Reports & Information Design
Case Study 1
Better Medicare Alliance
Telehealth & Virtual Care | Report Design
Year: 2022
Deliverables: 21-page report including data visualizations, infographics, editorial design
The Brief
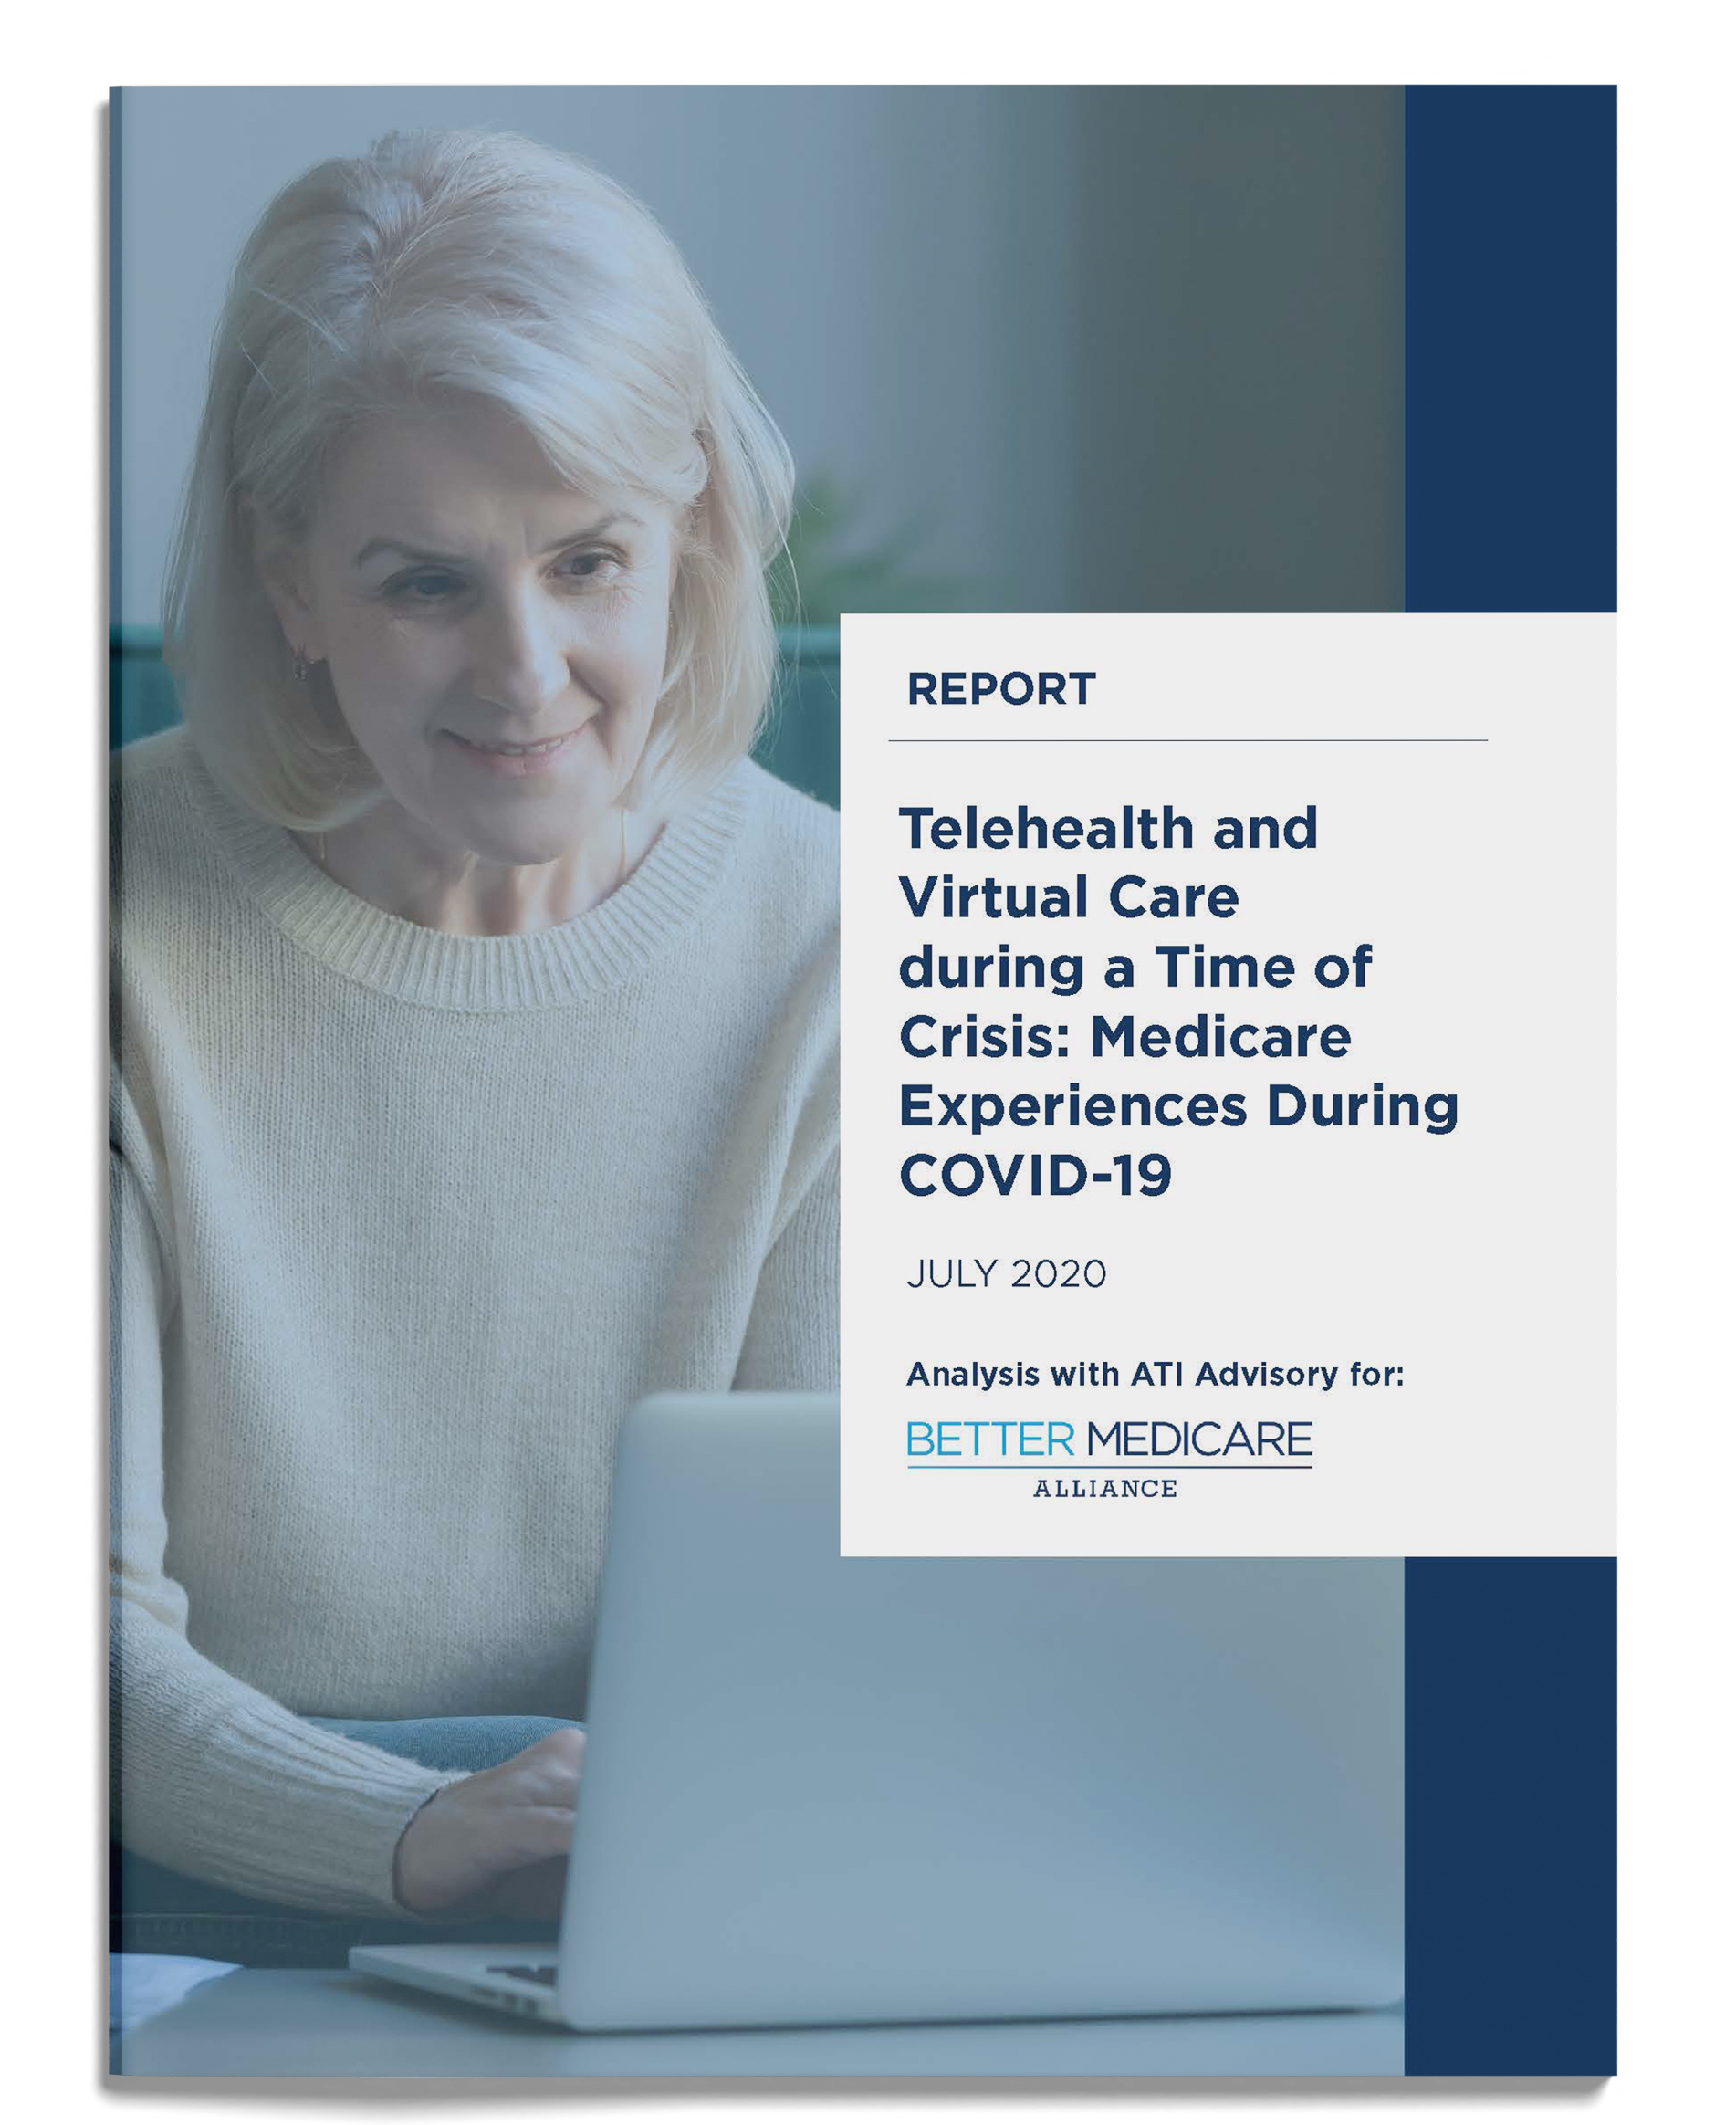
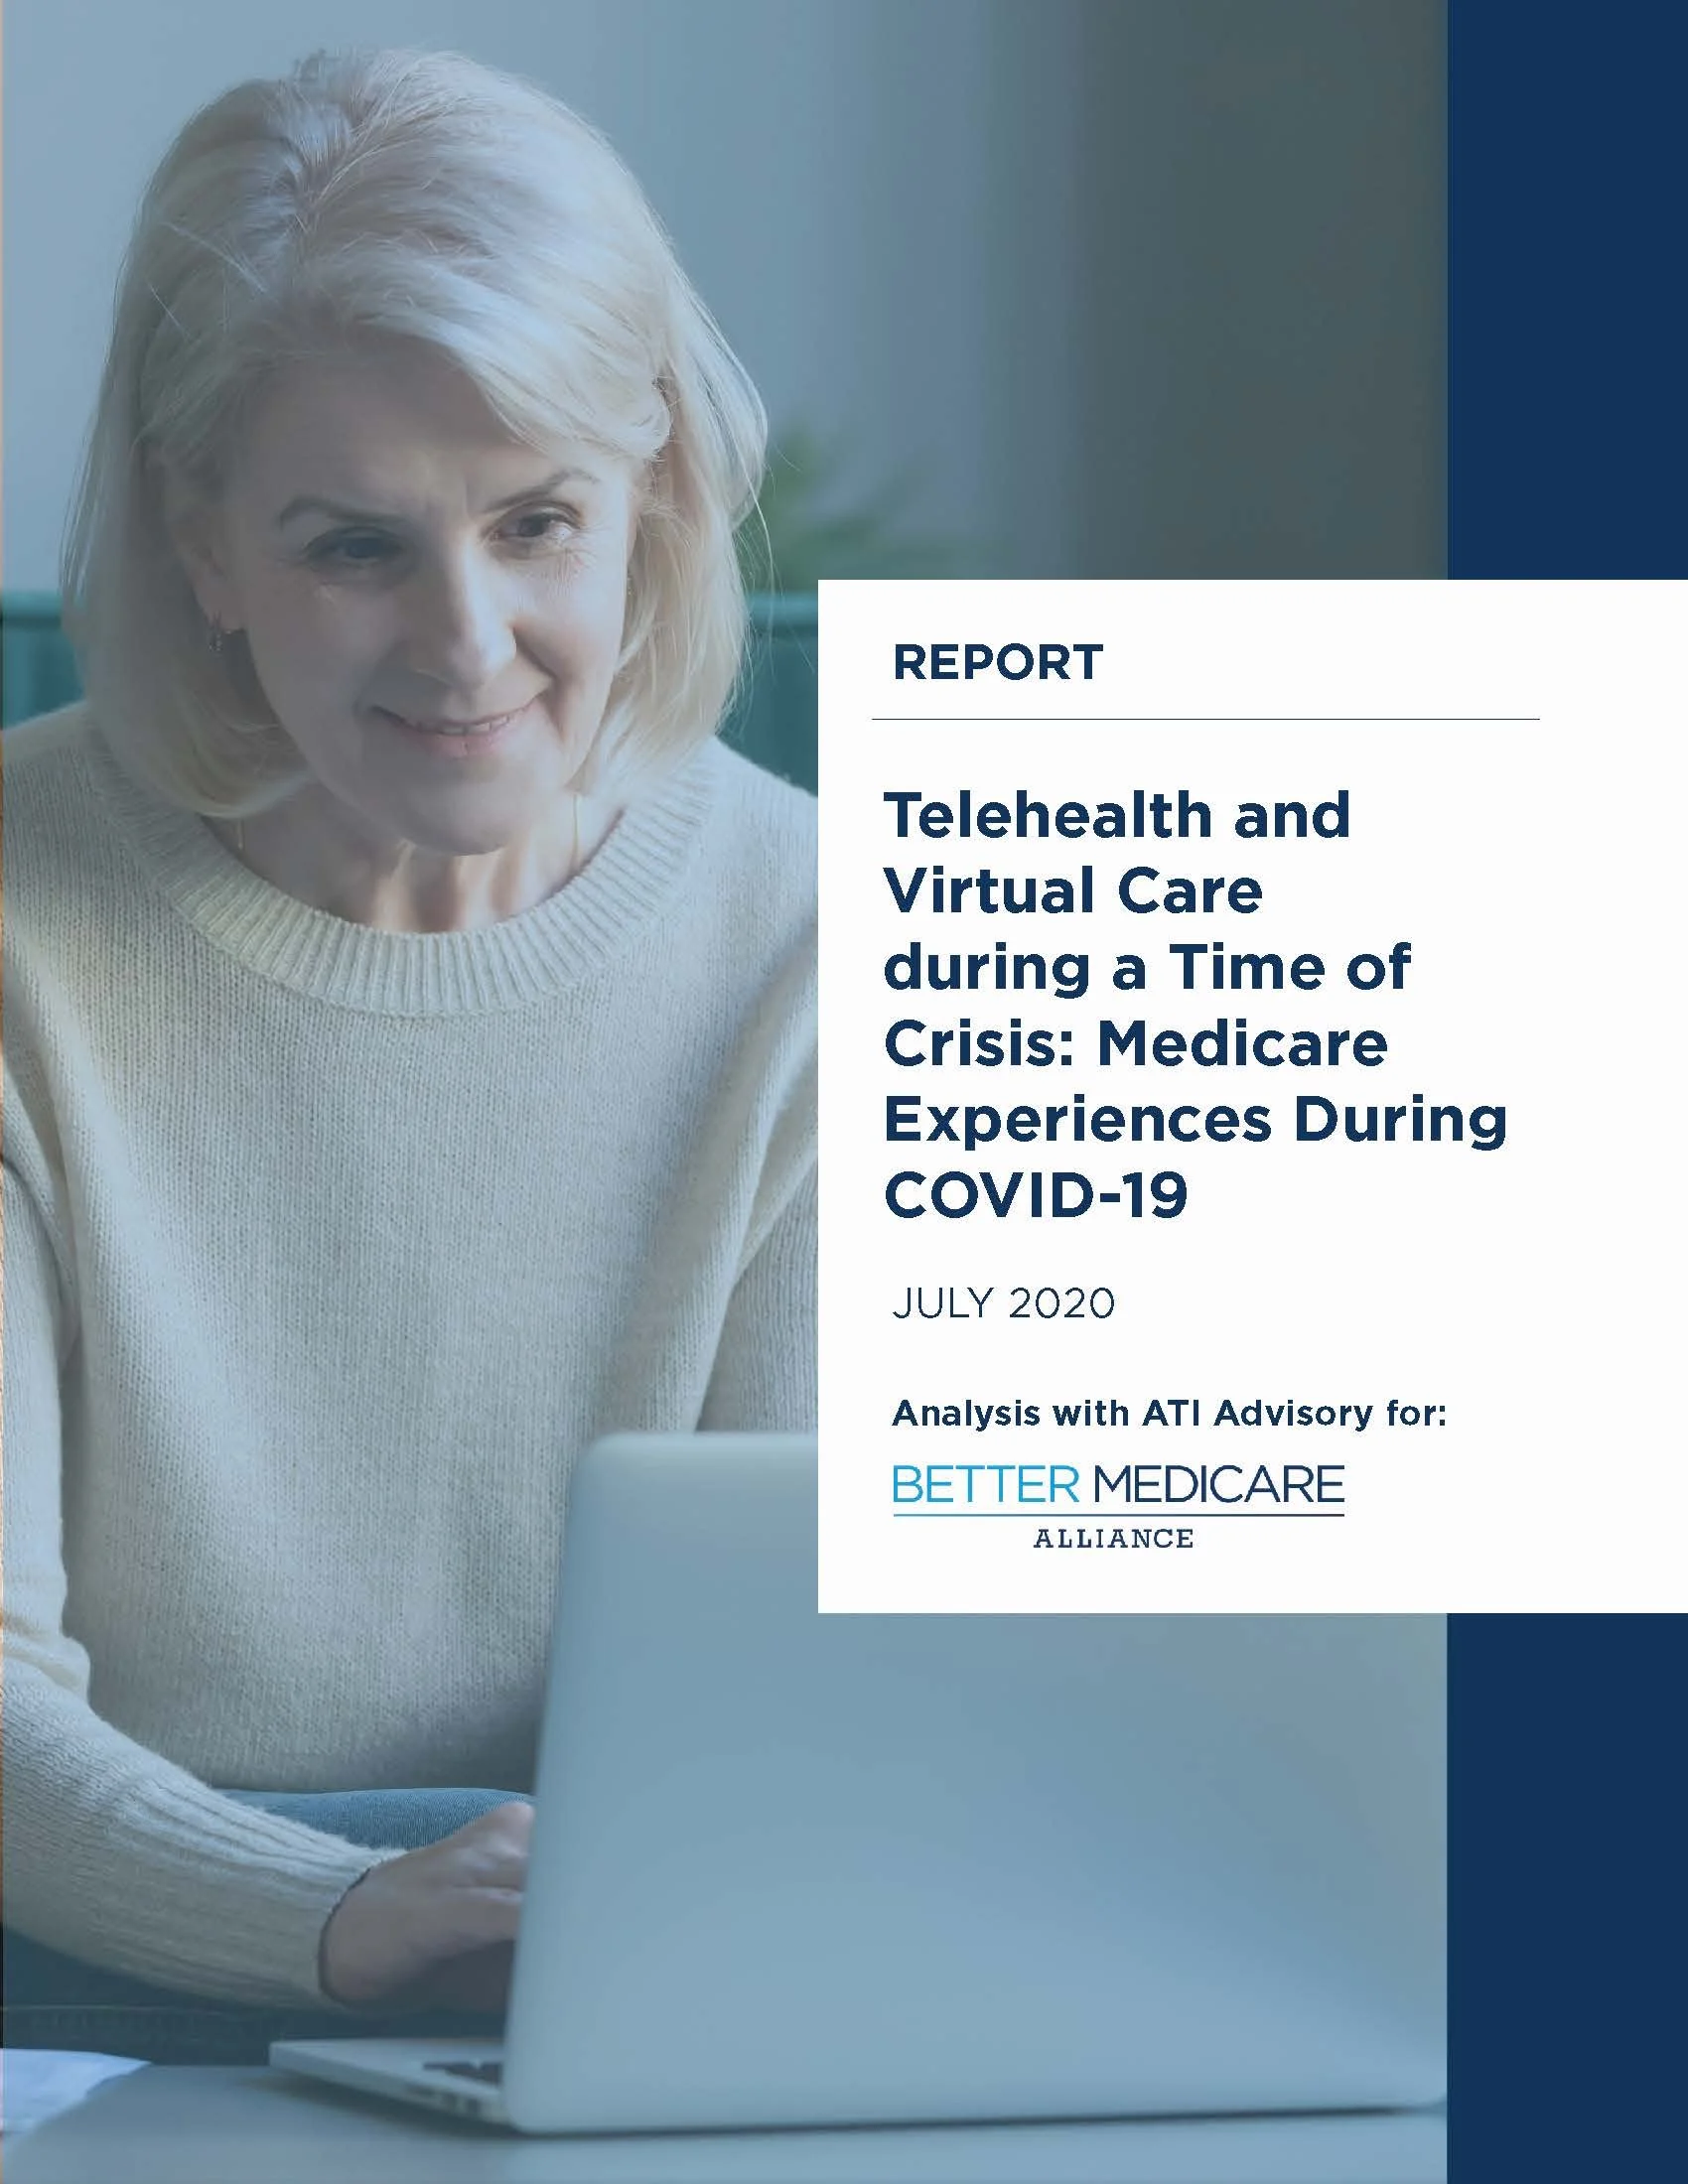
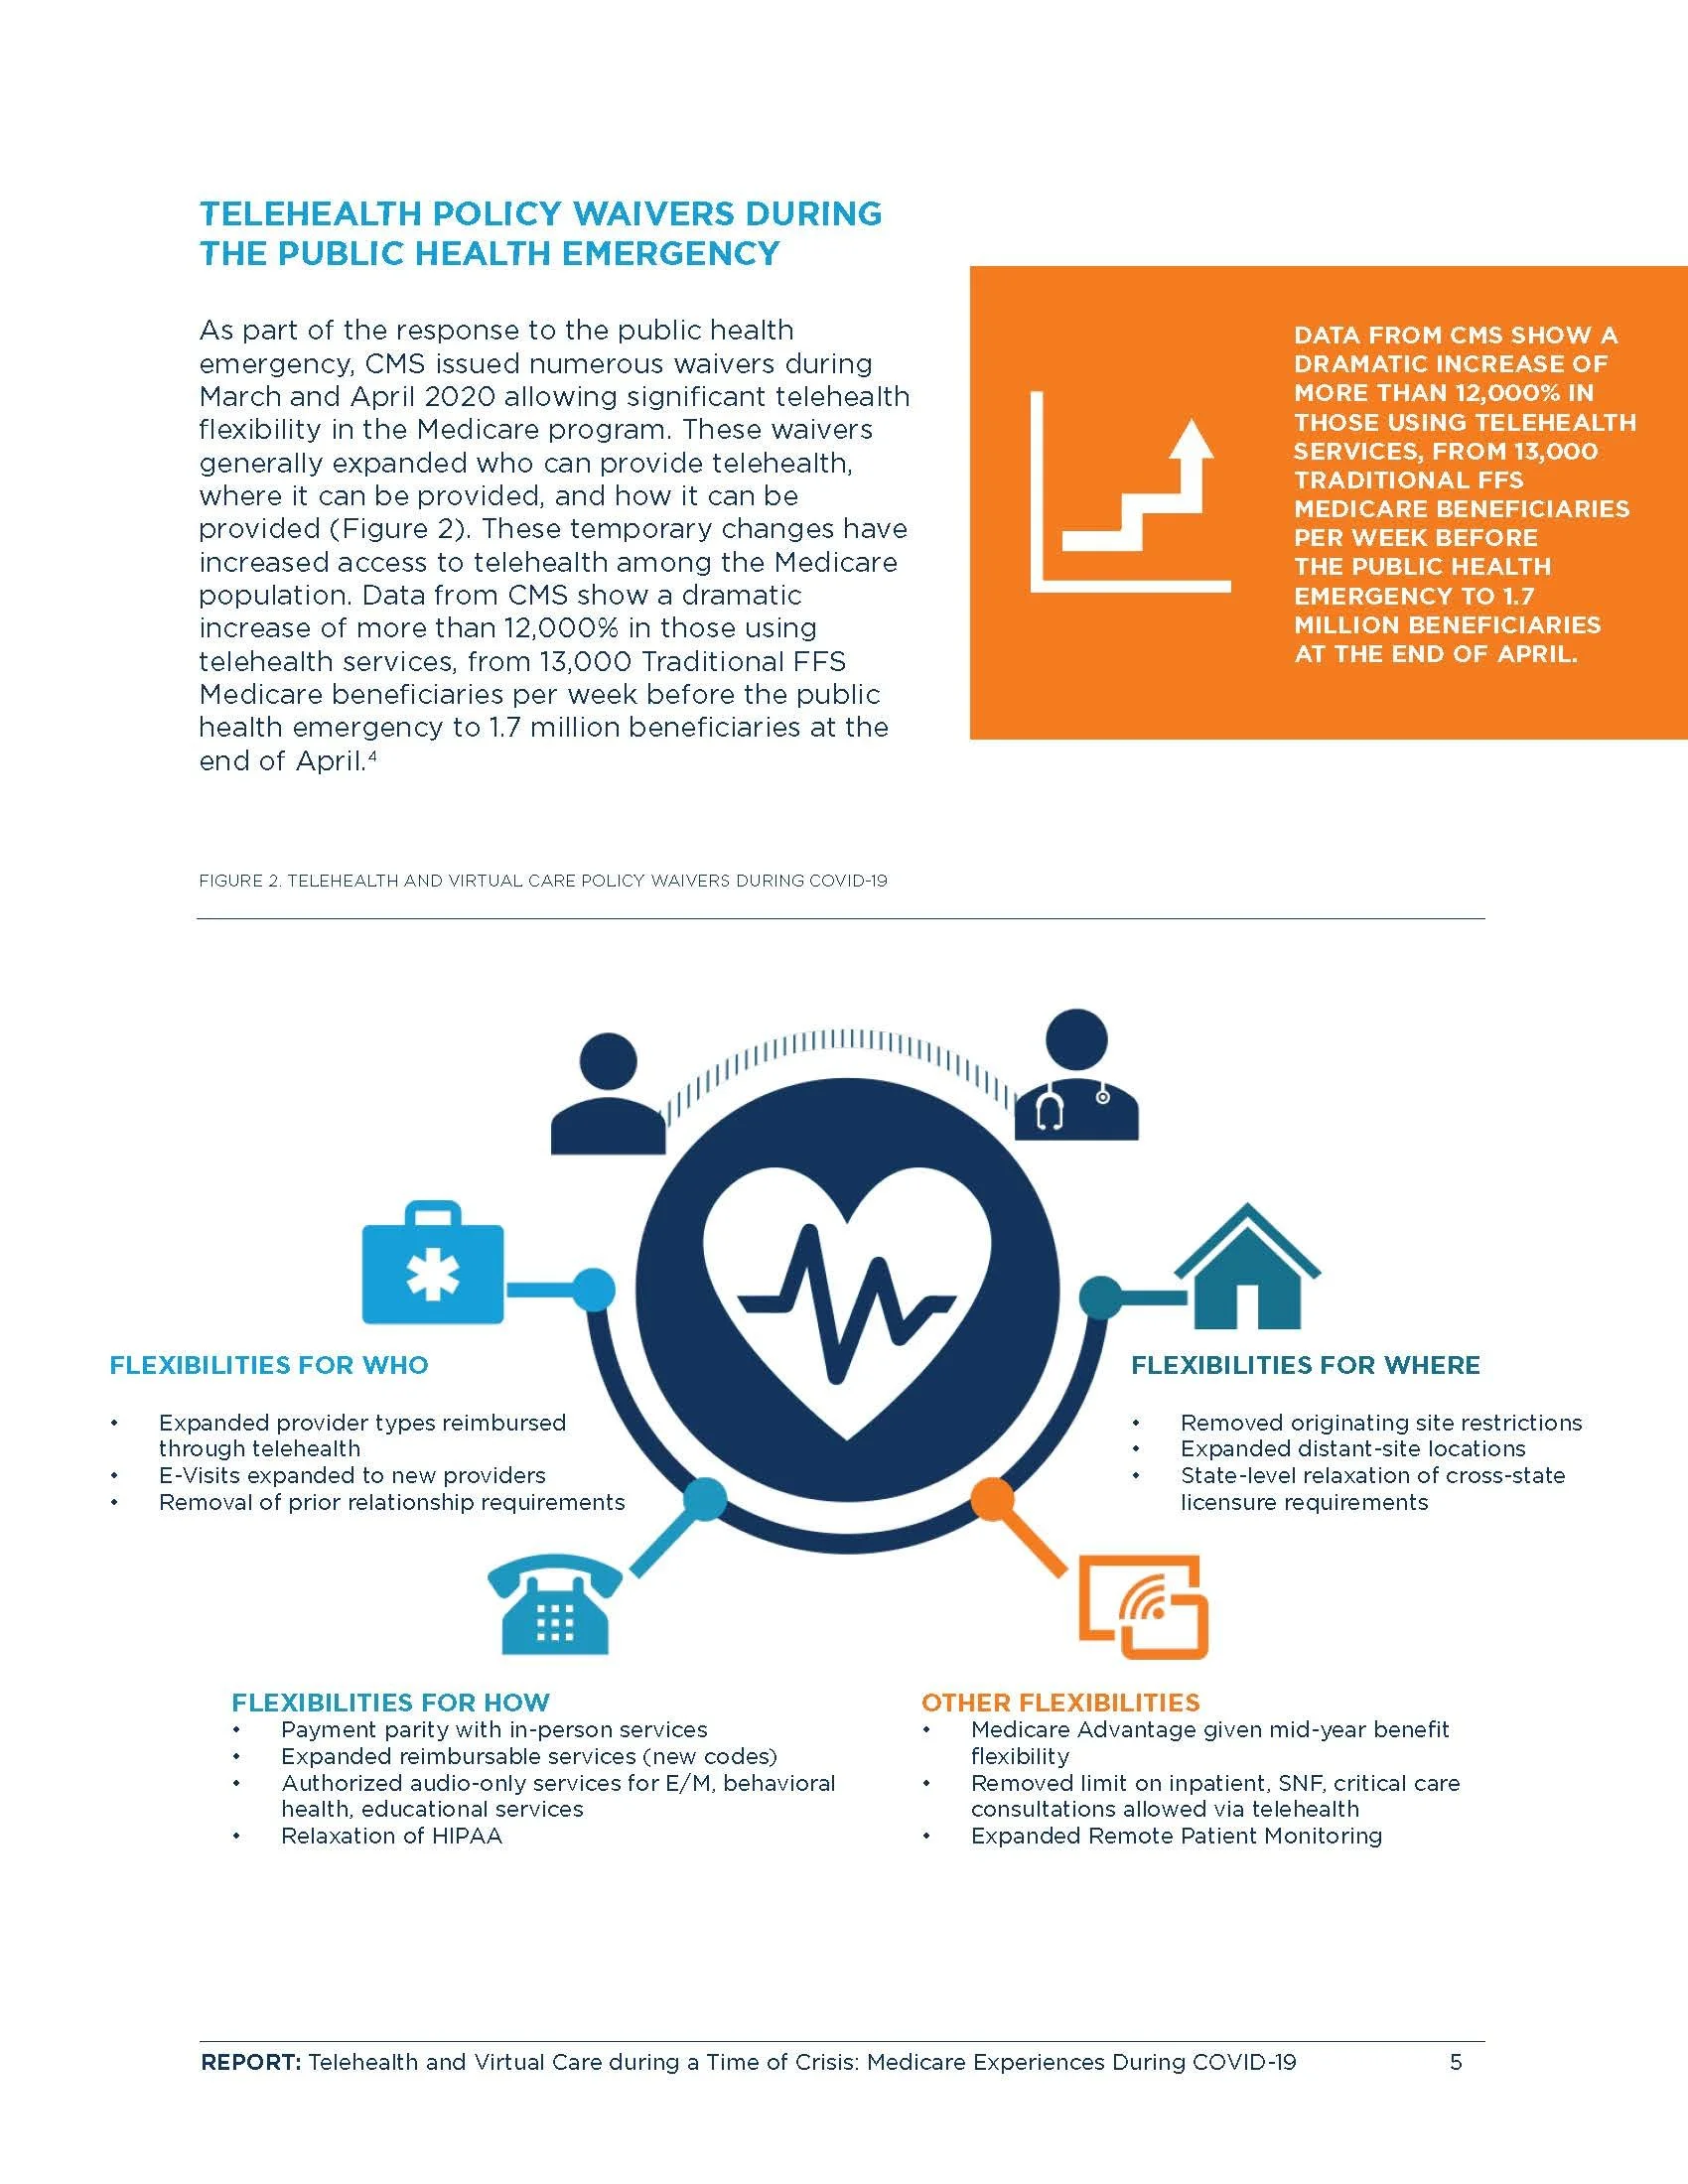
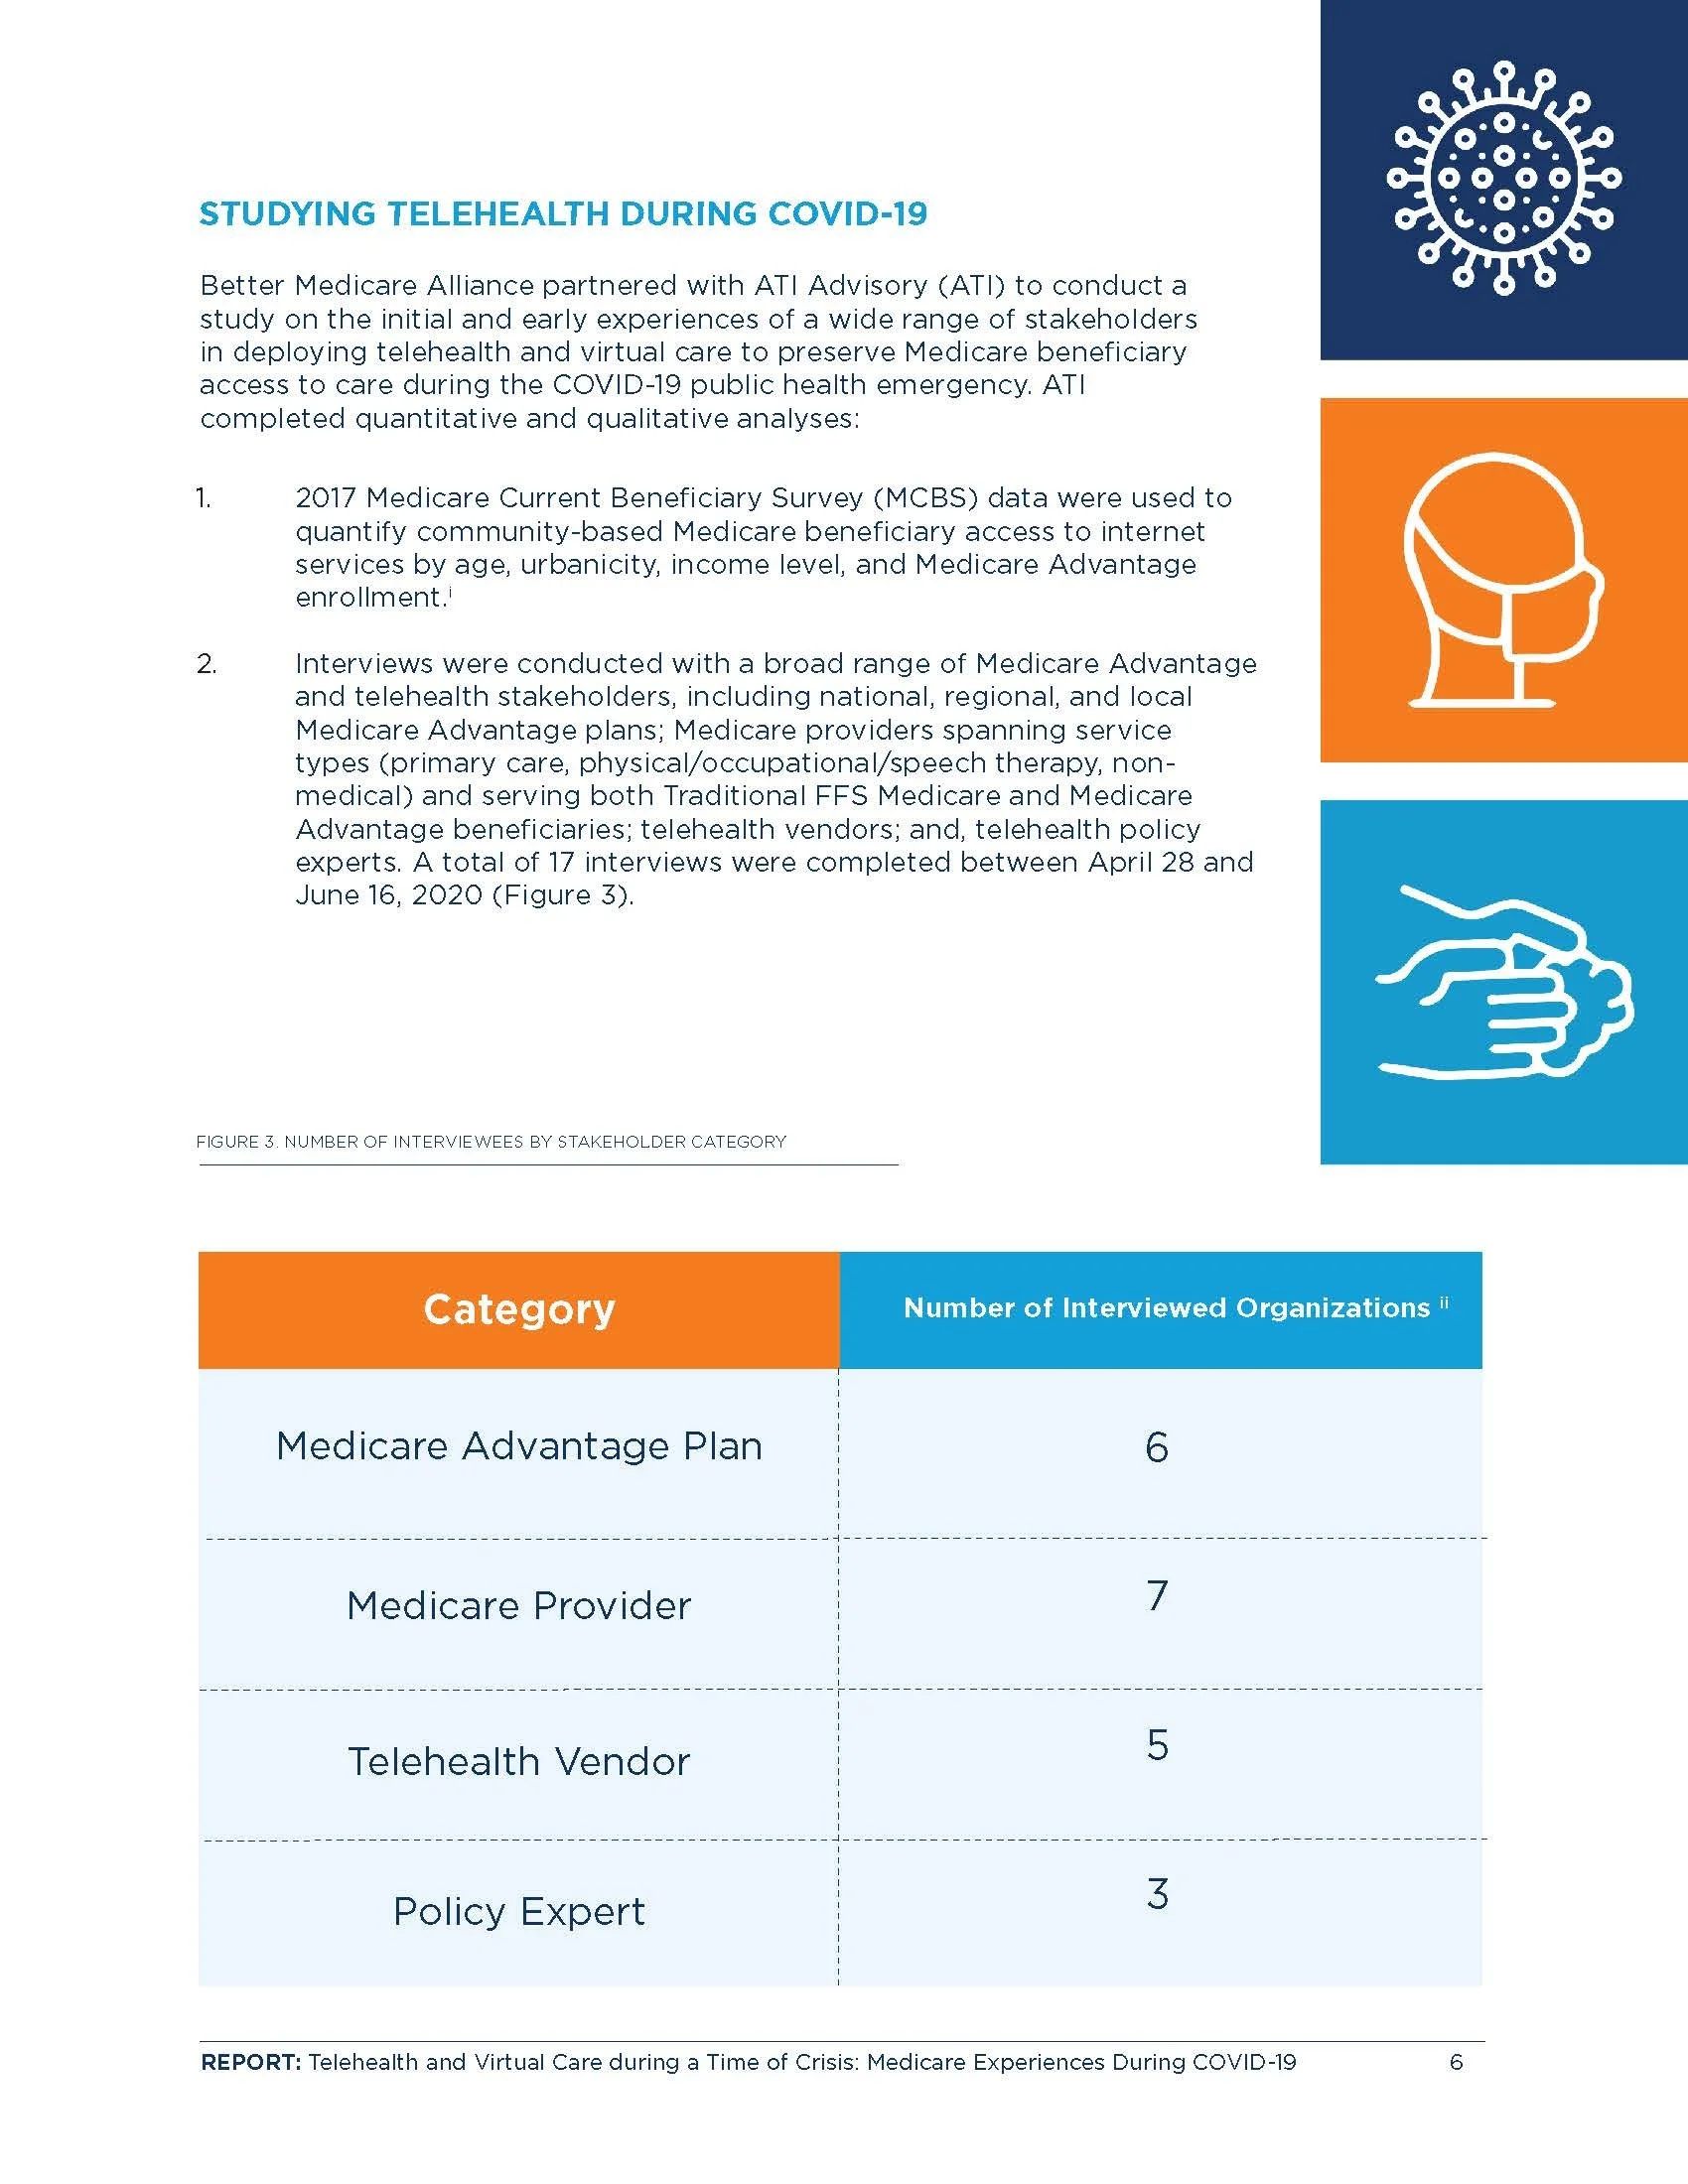
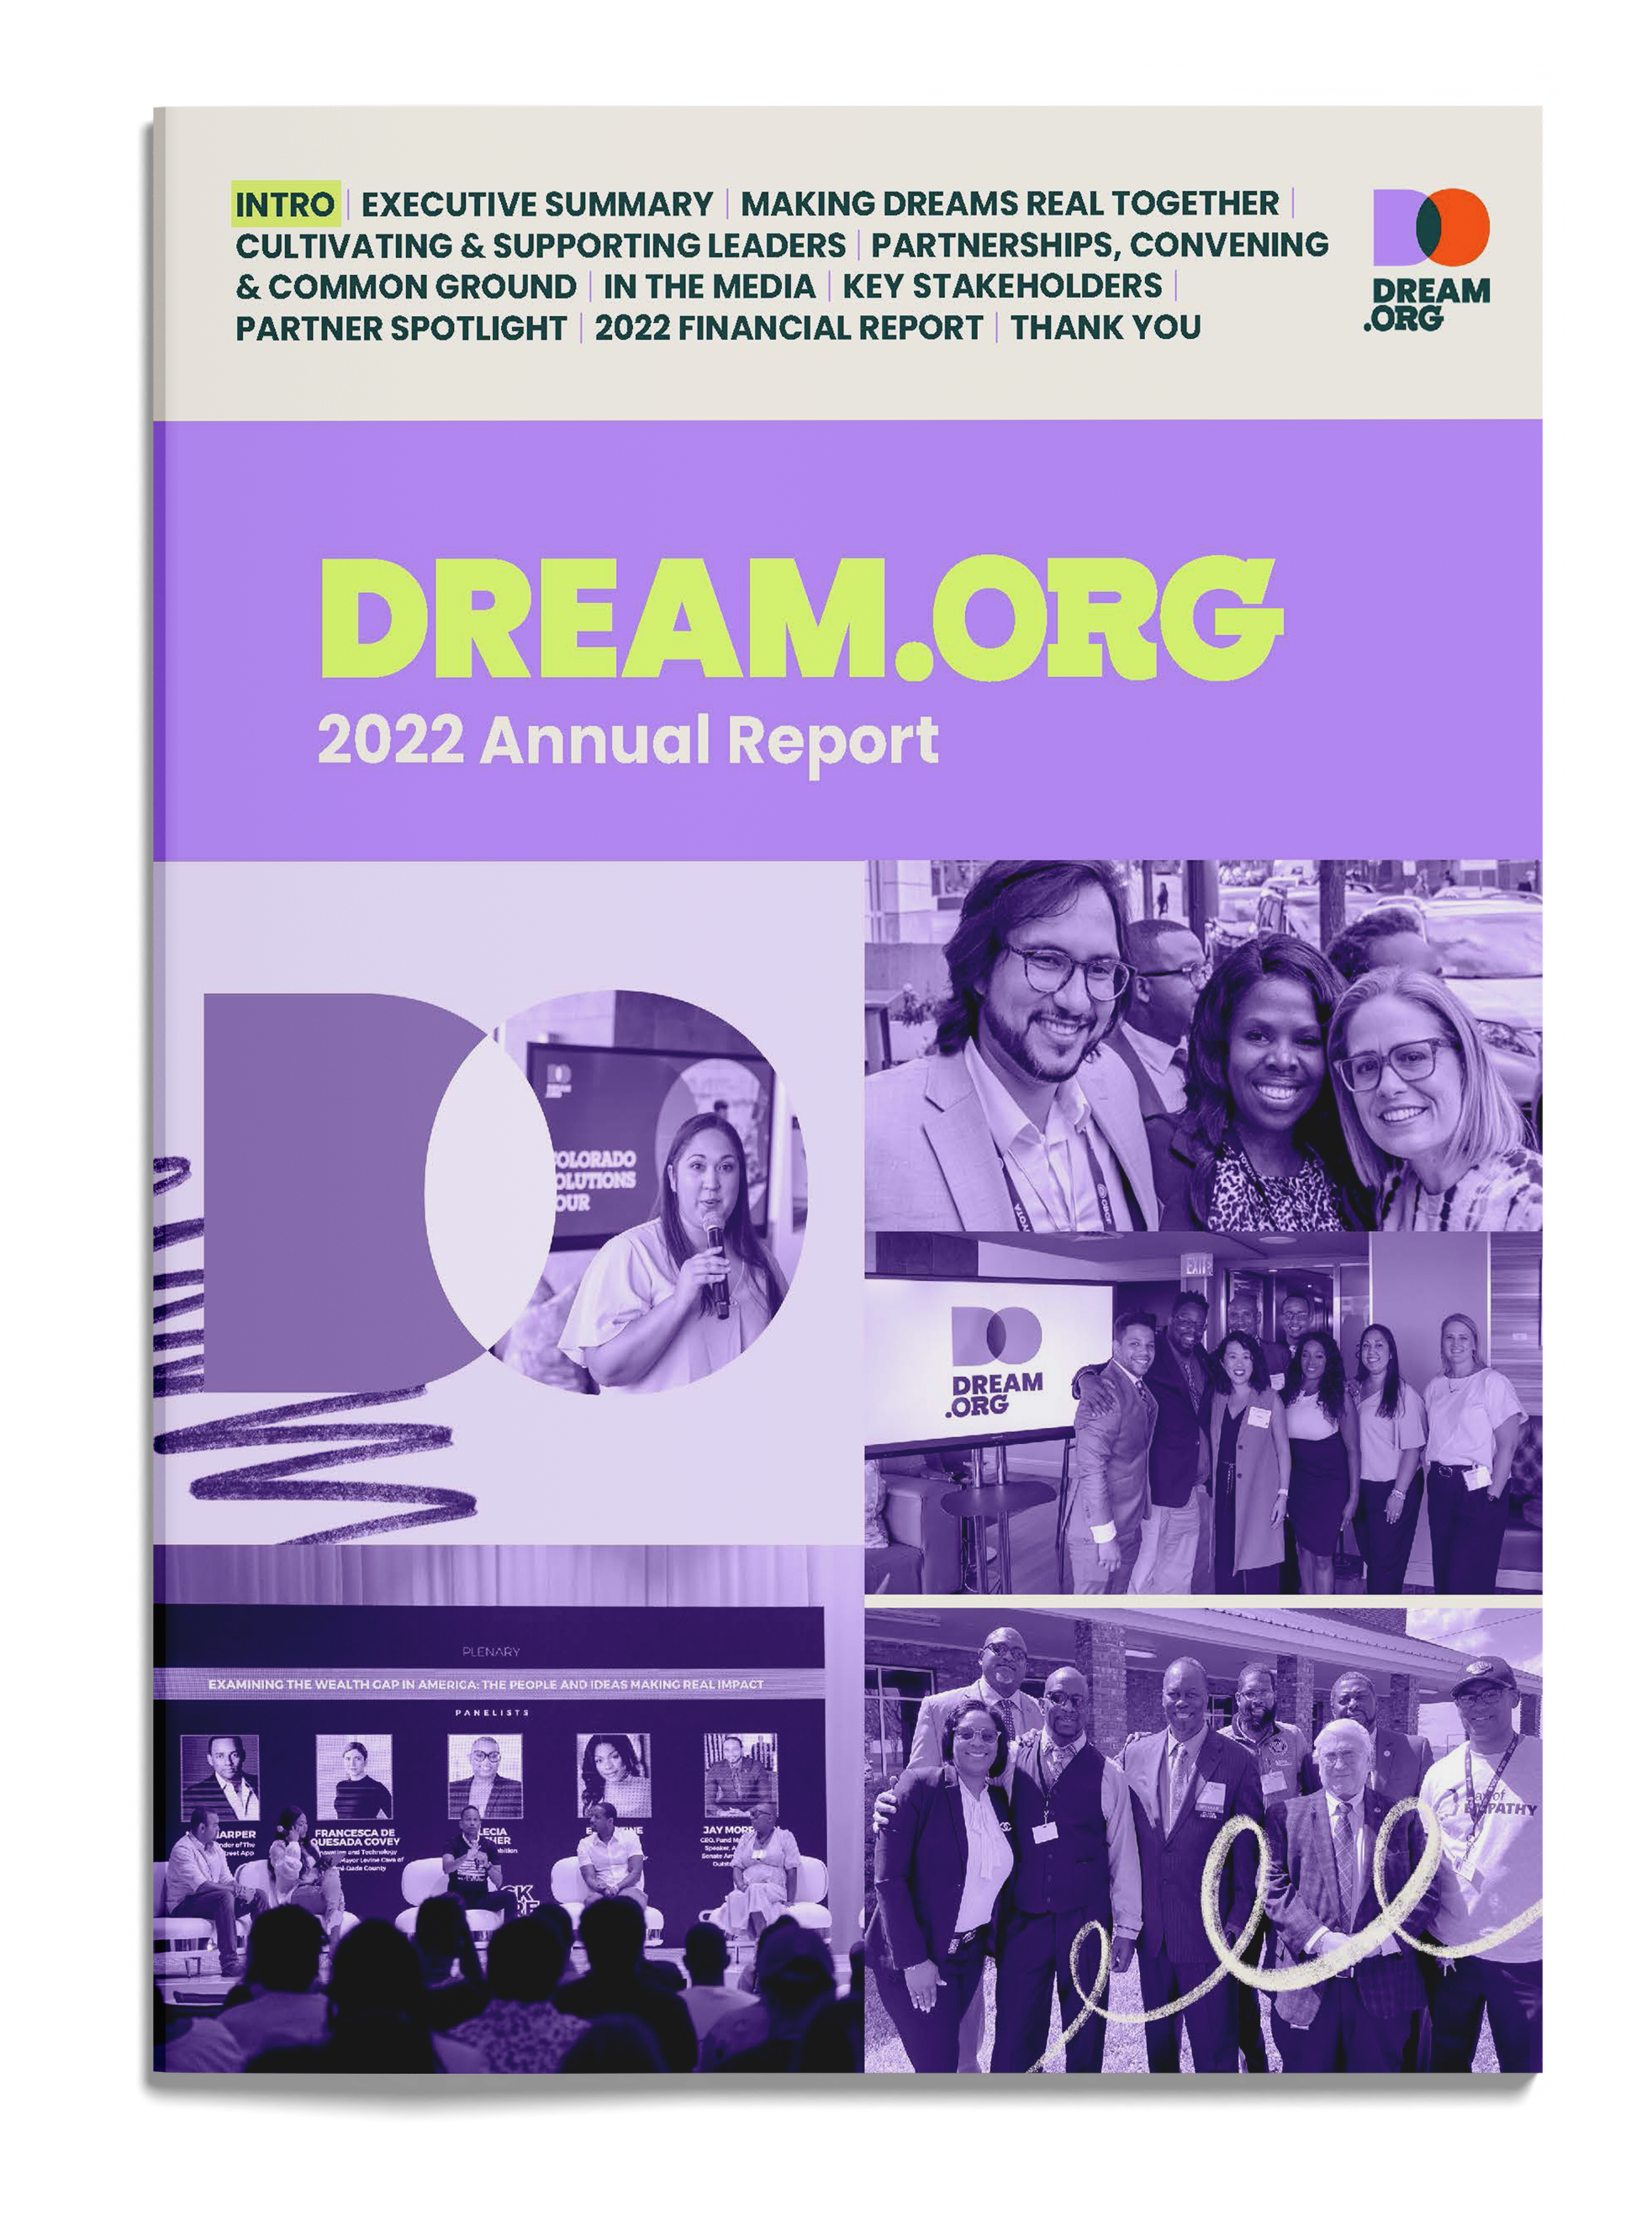
Better Medicare Alliance partnered with ATI Advisory to produce a report examining the role of telehealth during the COVID-19 pandemic. The report explored how virtual care was being implemented, barriers to access, and the impact on Medicare beneficiaries.
From Dense Copy to Clear Visuals
Reconstruction of the original design brief:
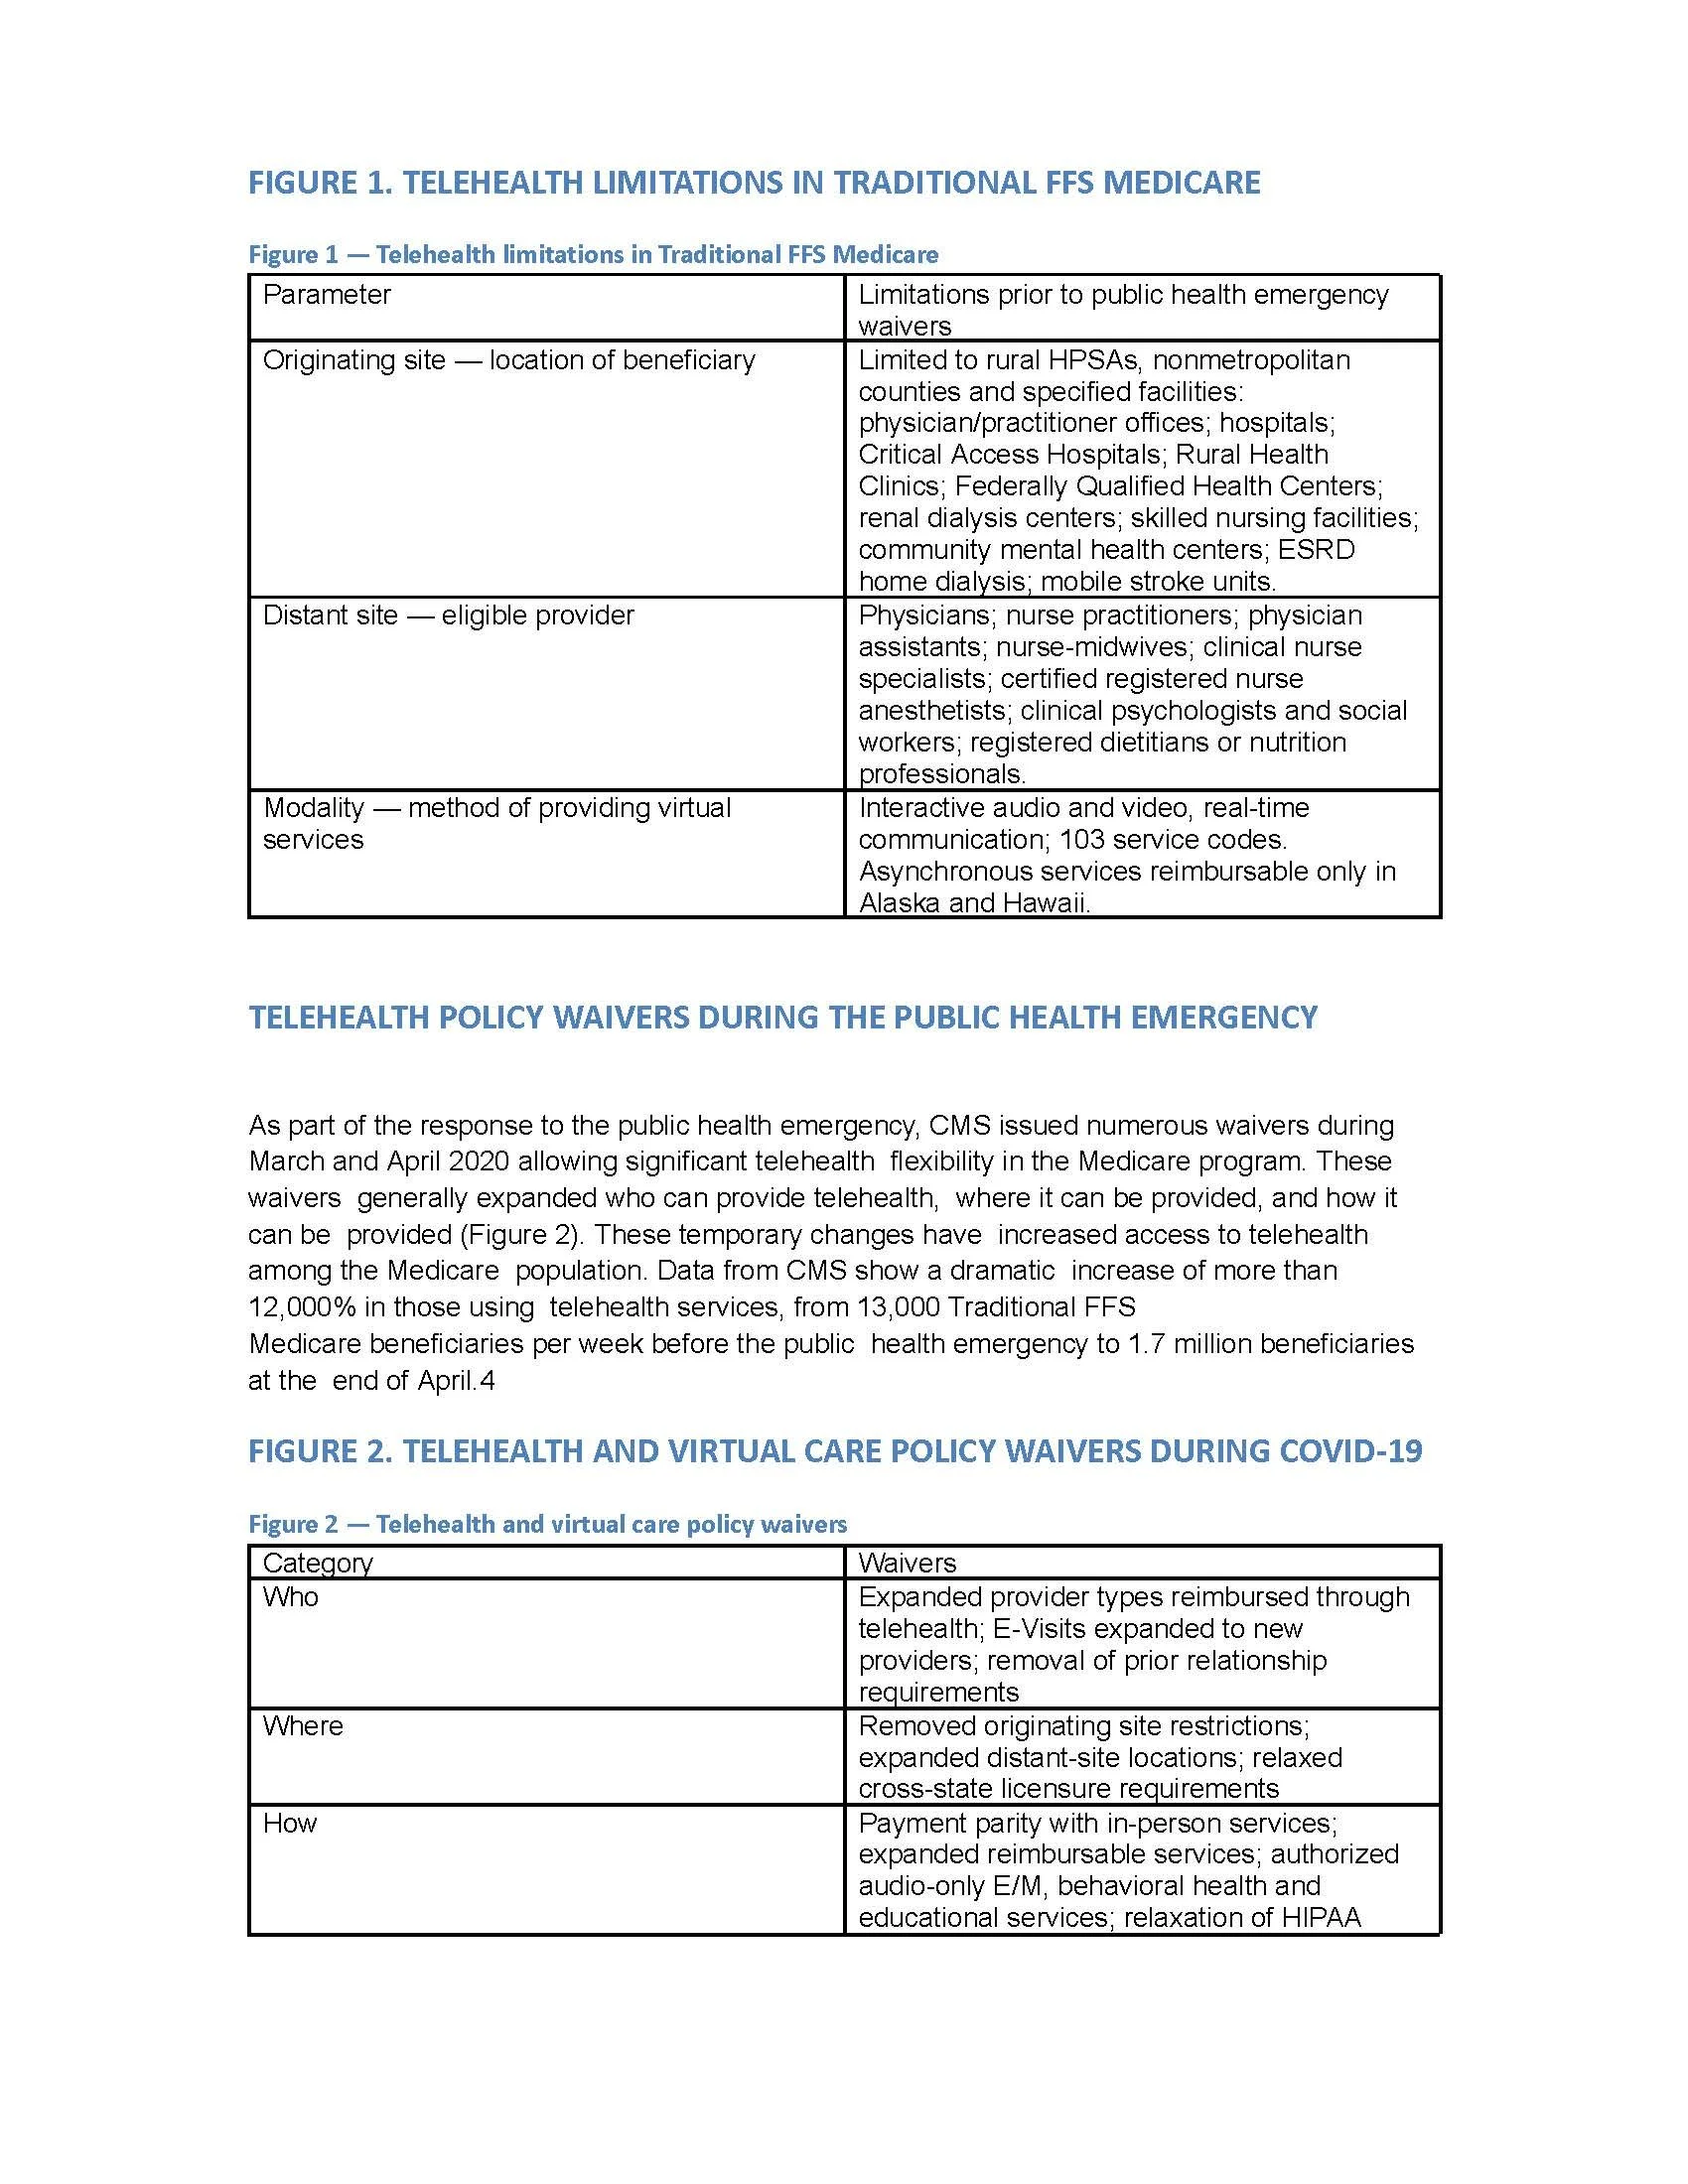
A document containing the report's written content, data, and unbranded charts.
Before
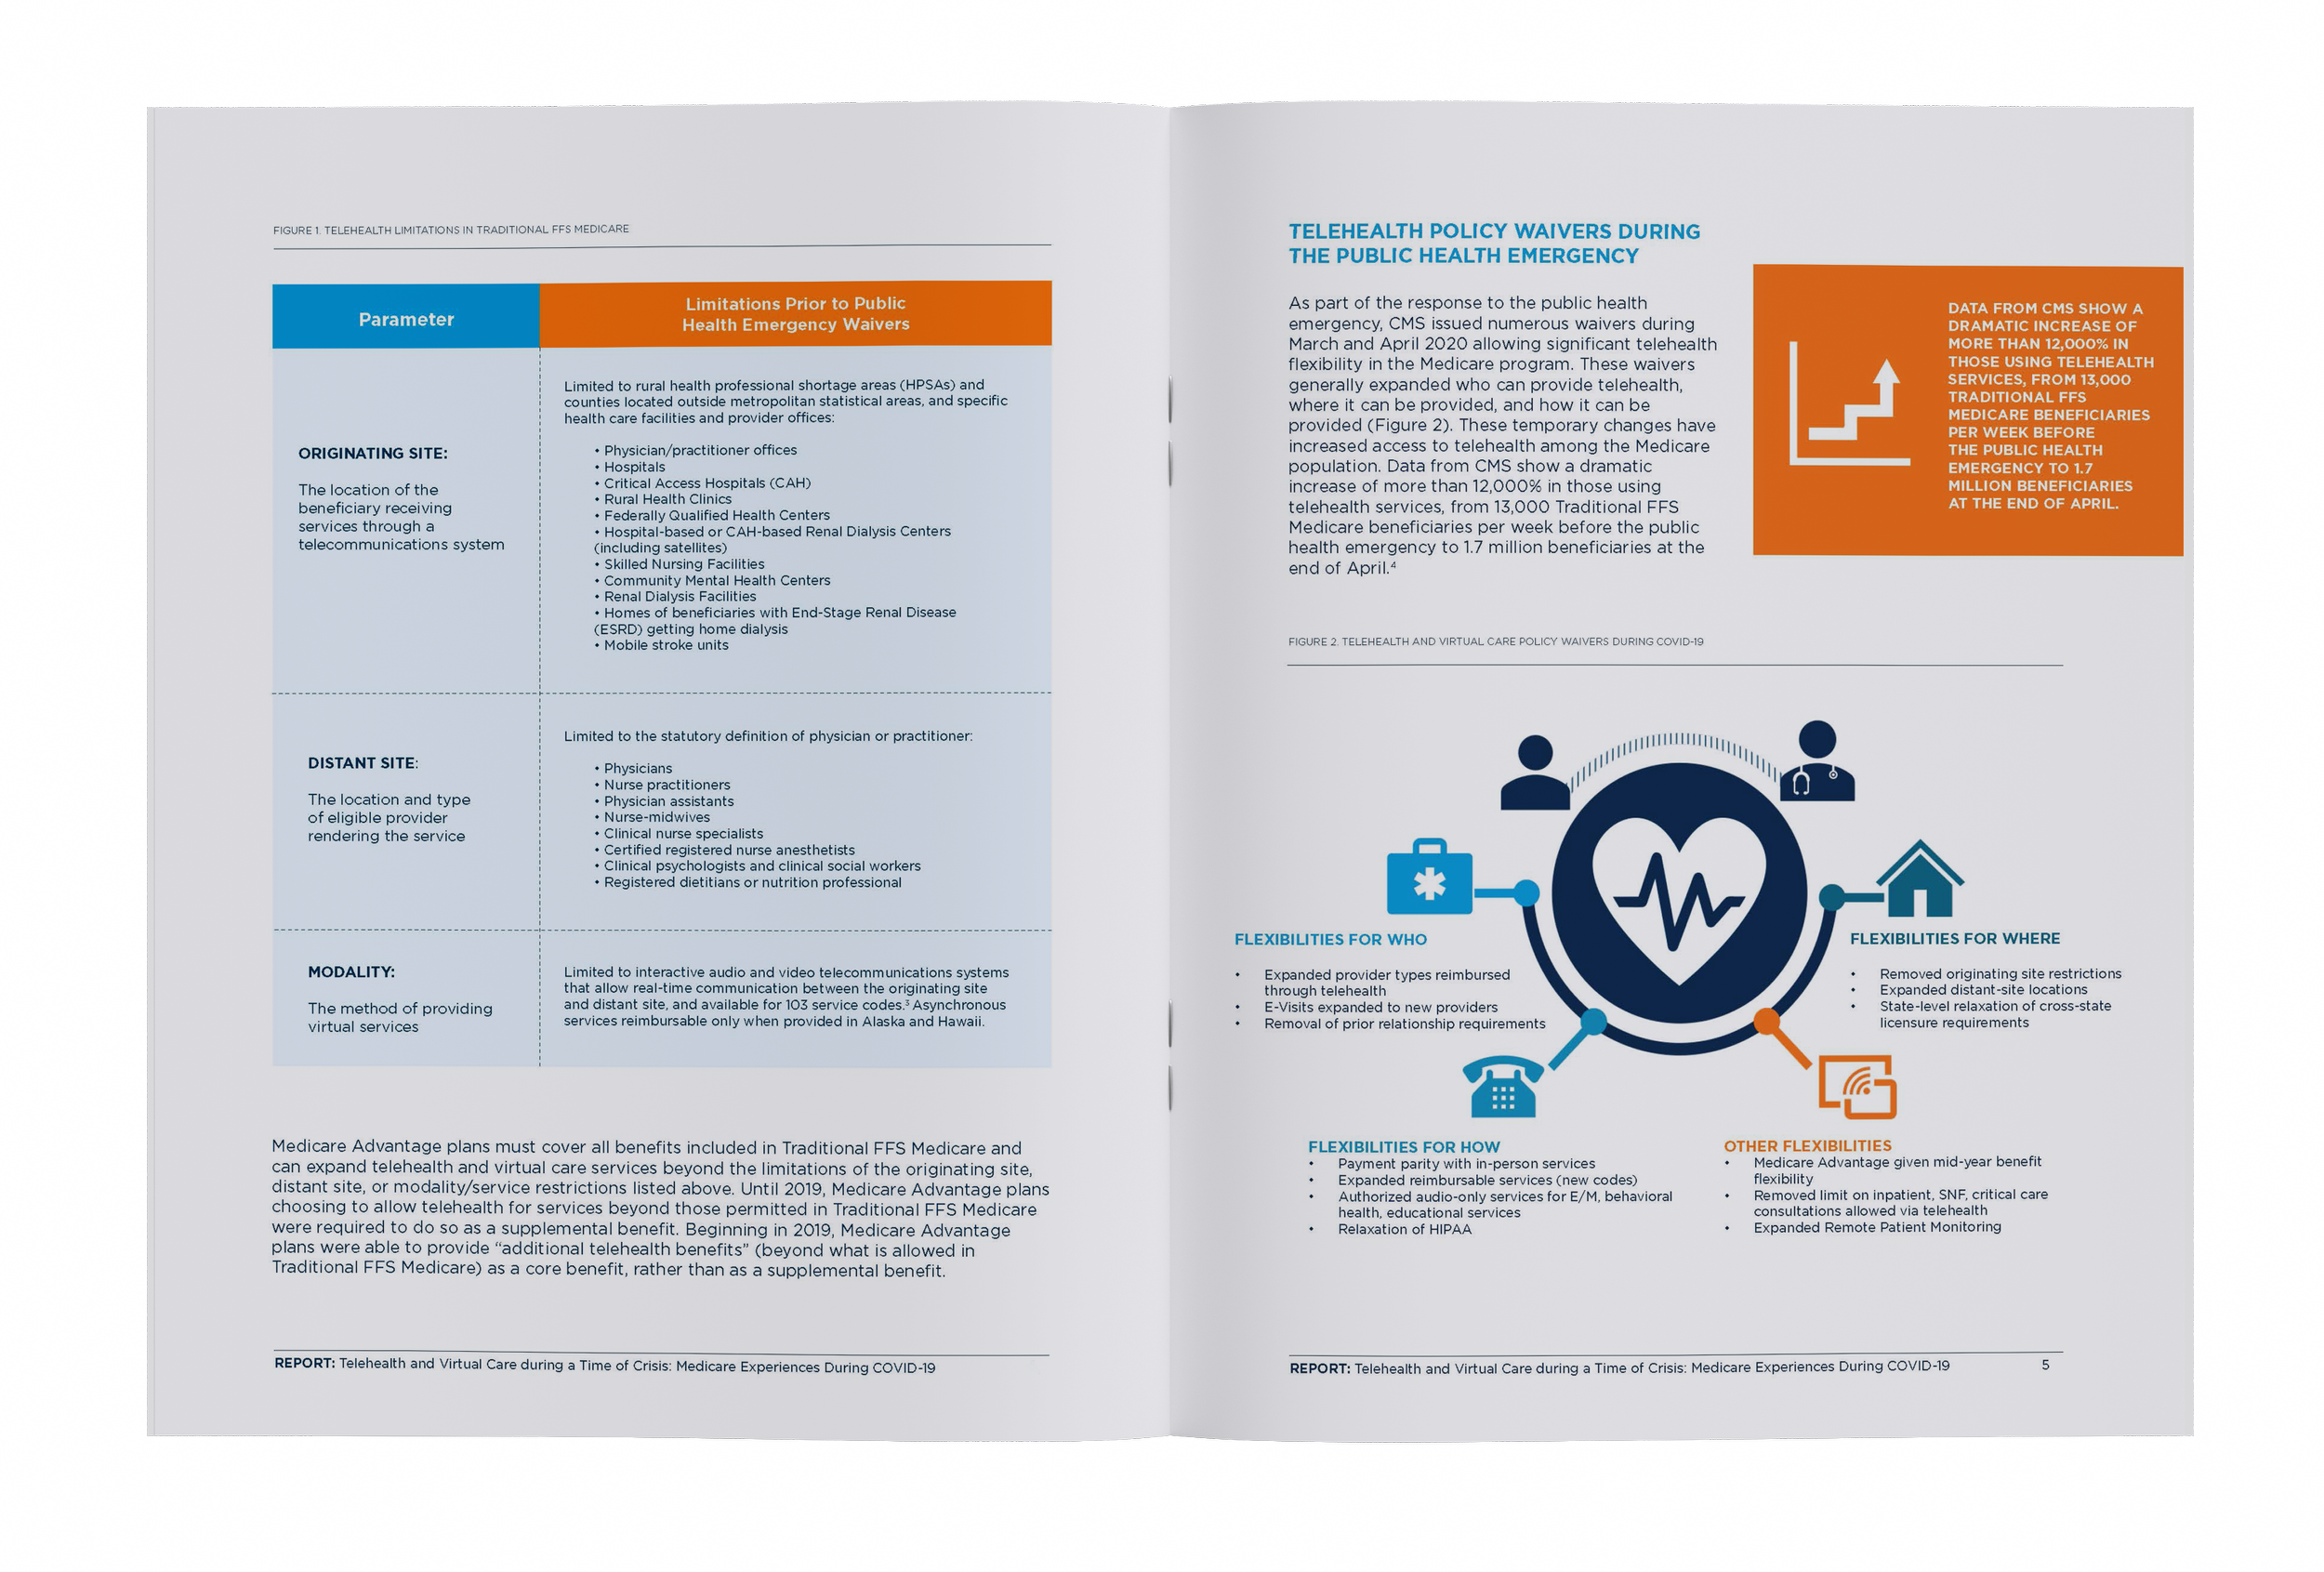
After
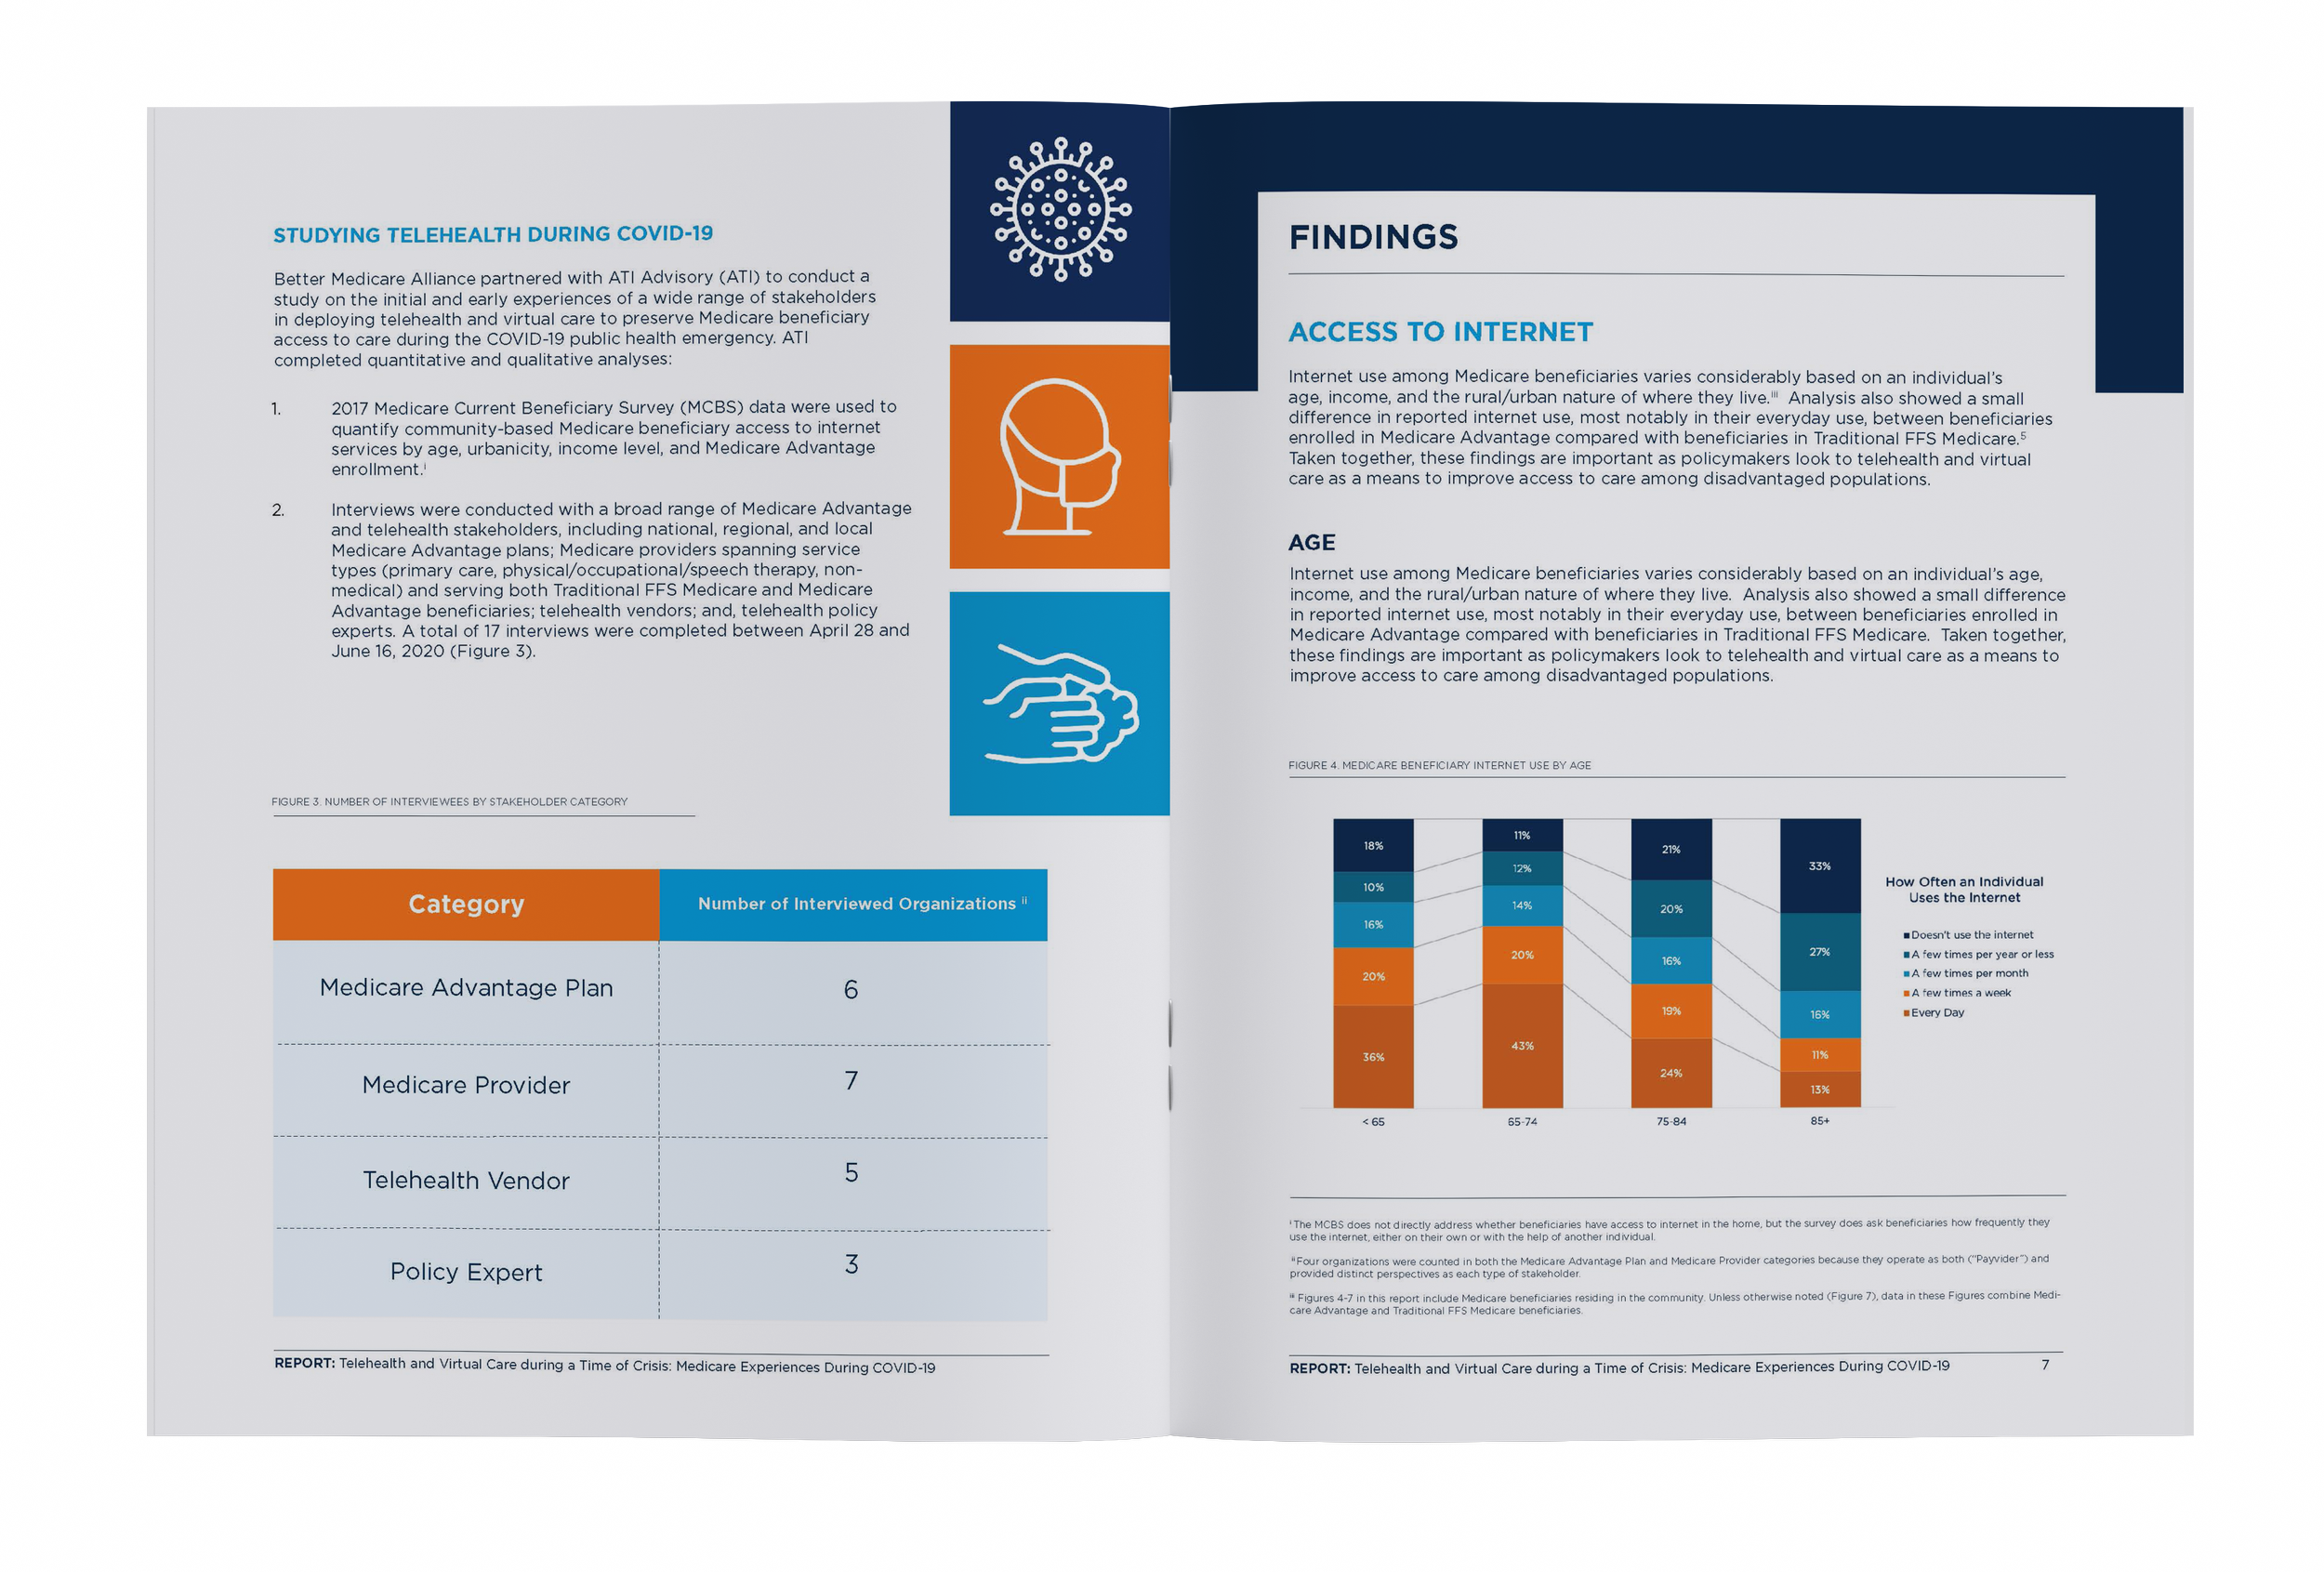
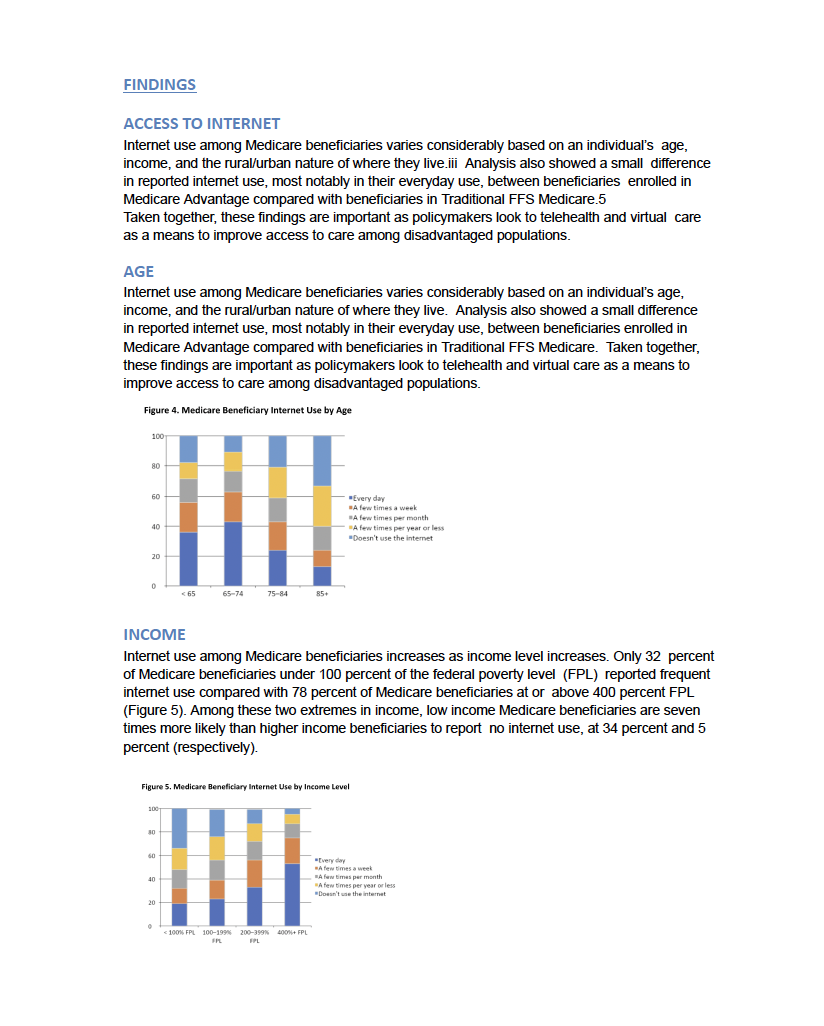
Before
After
Design Approach
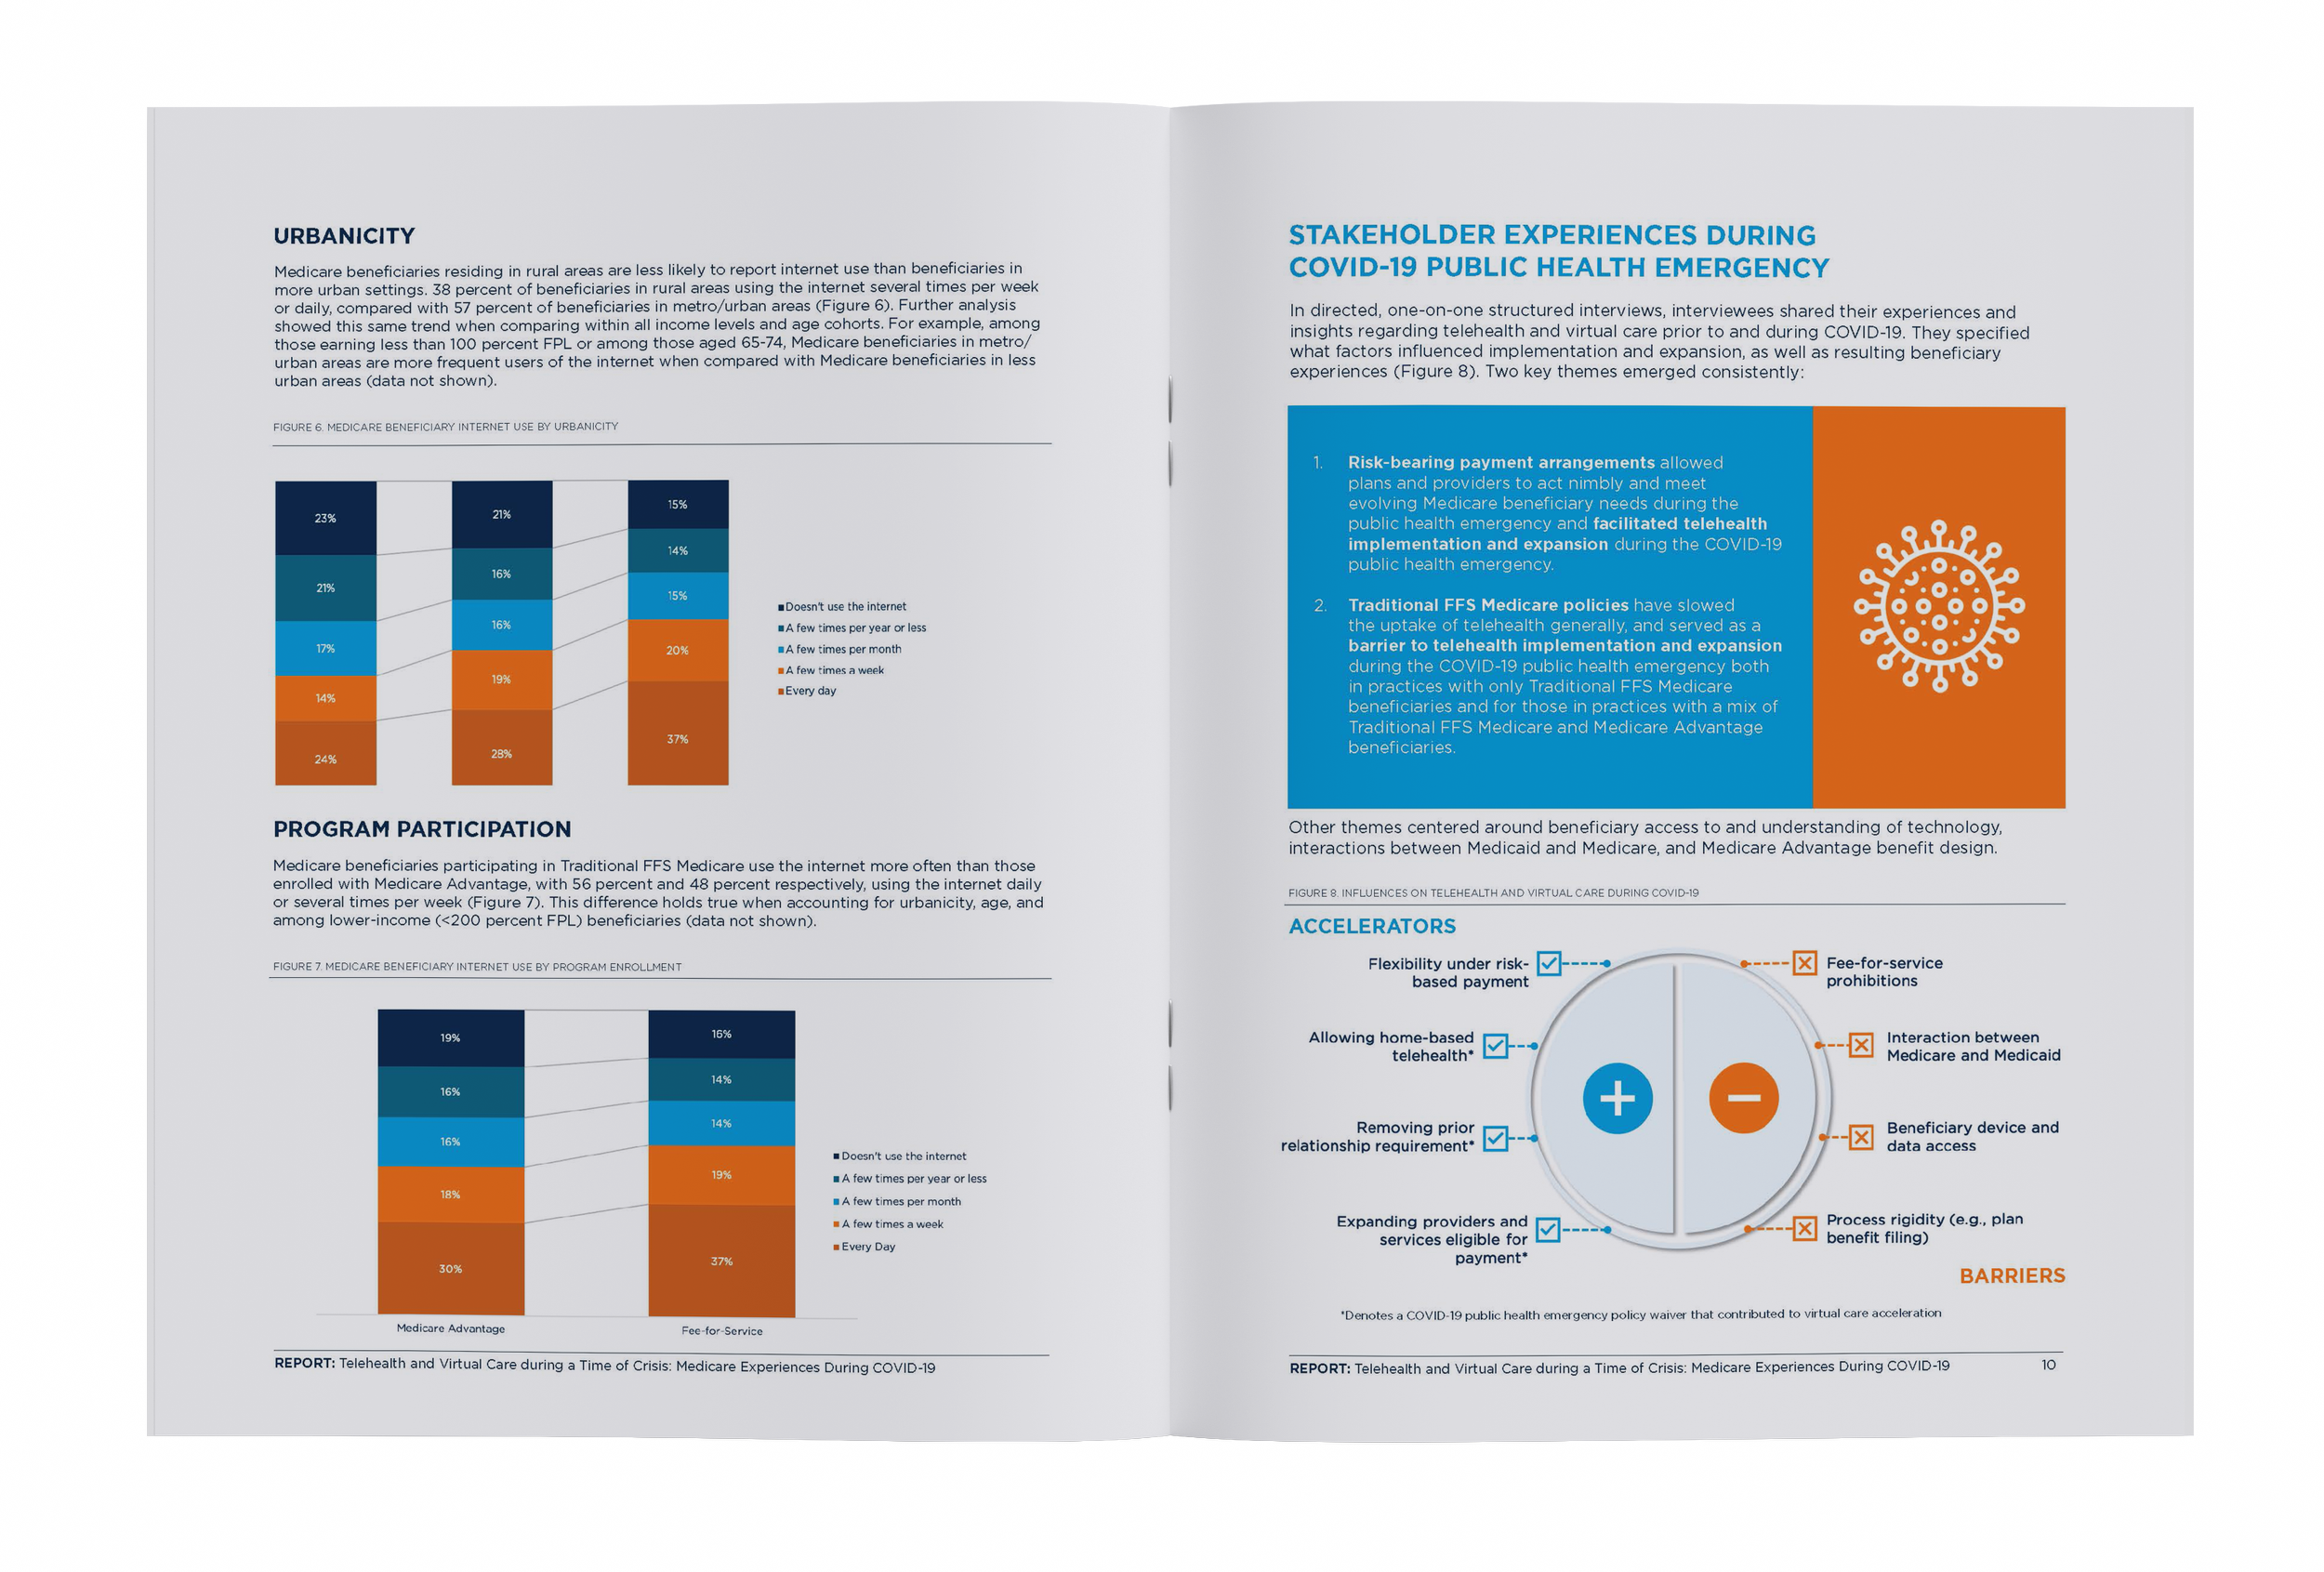
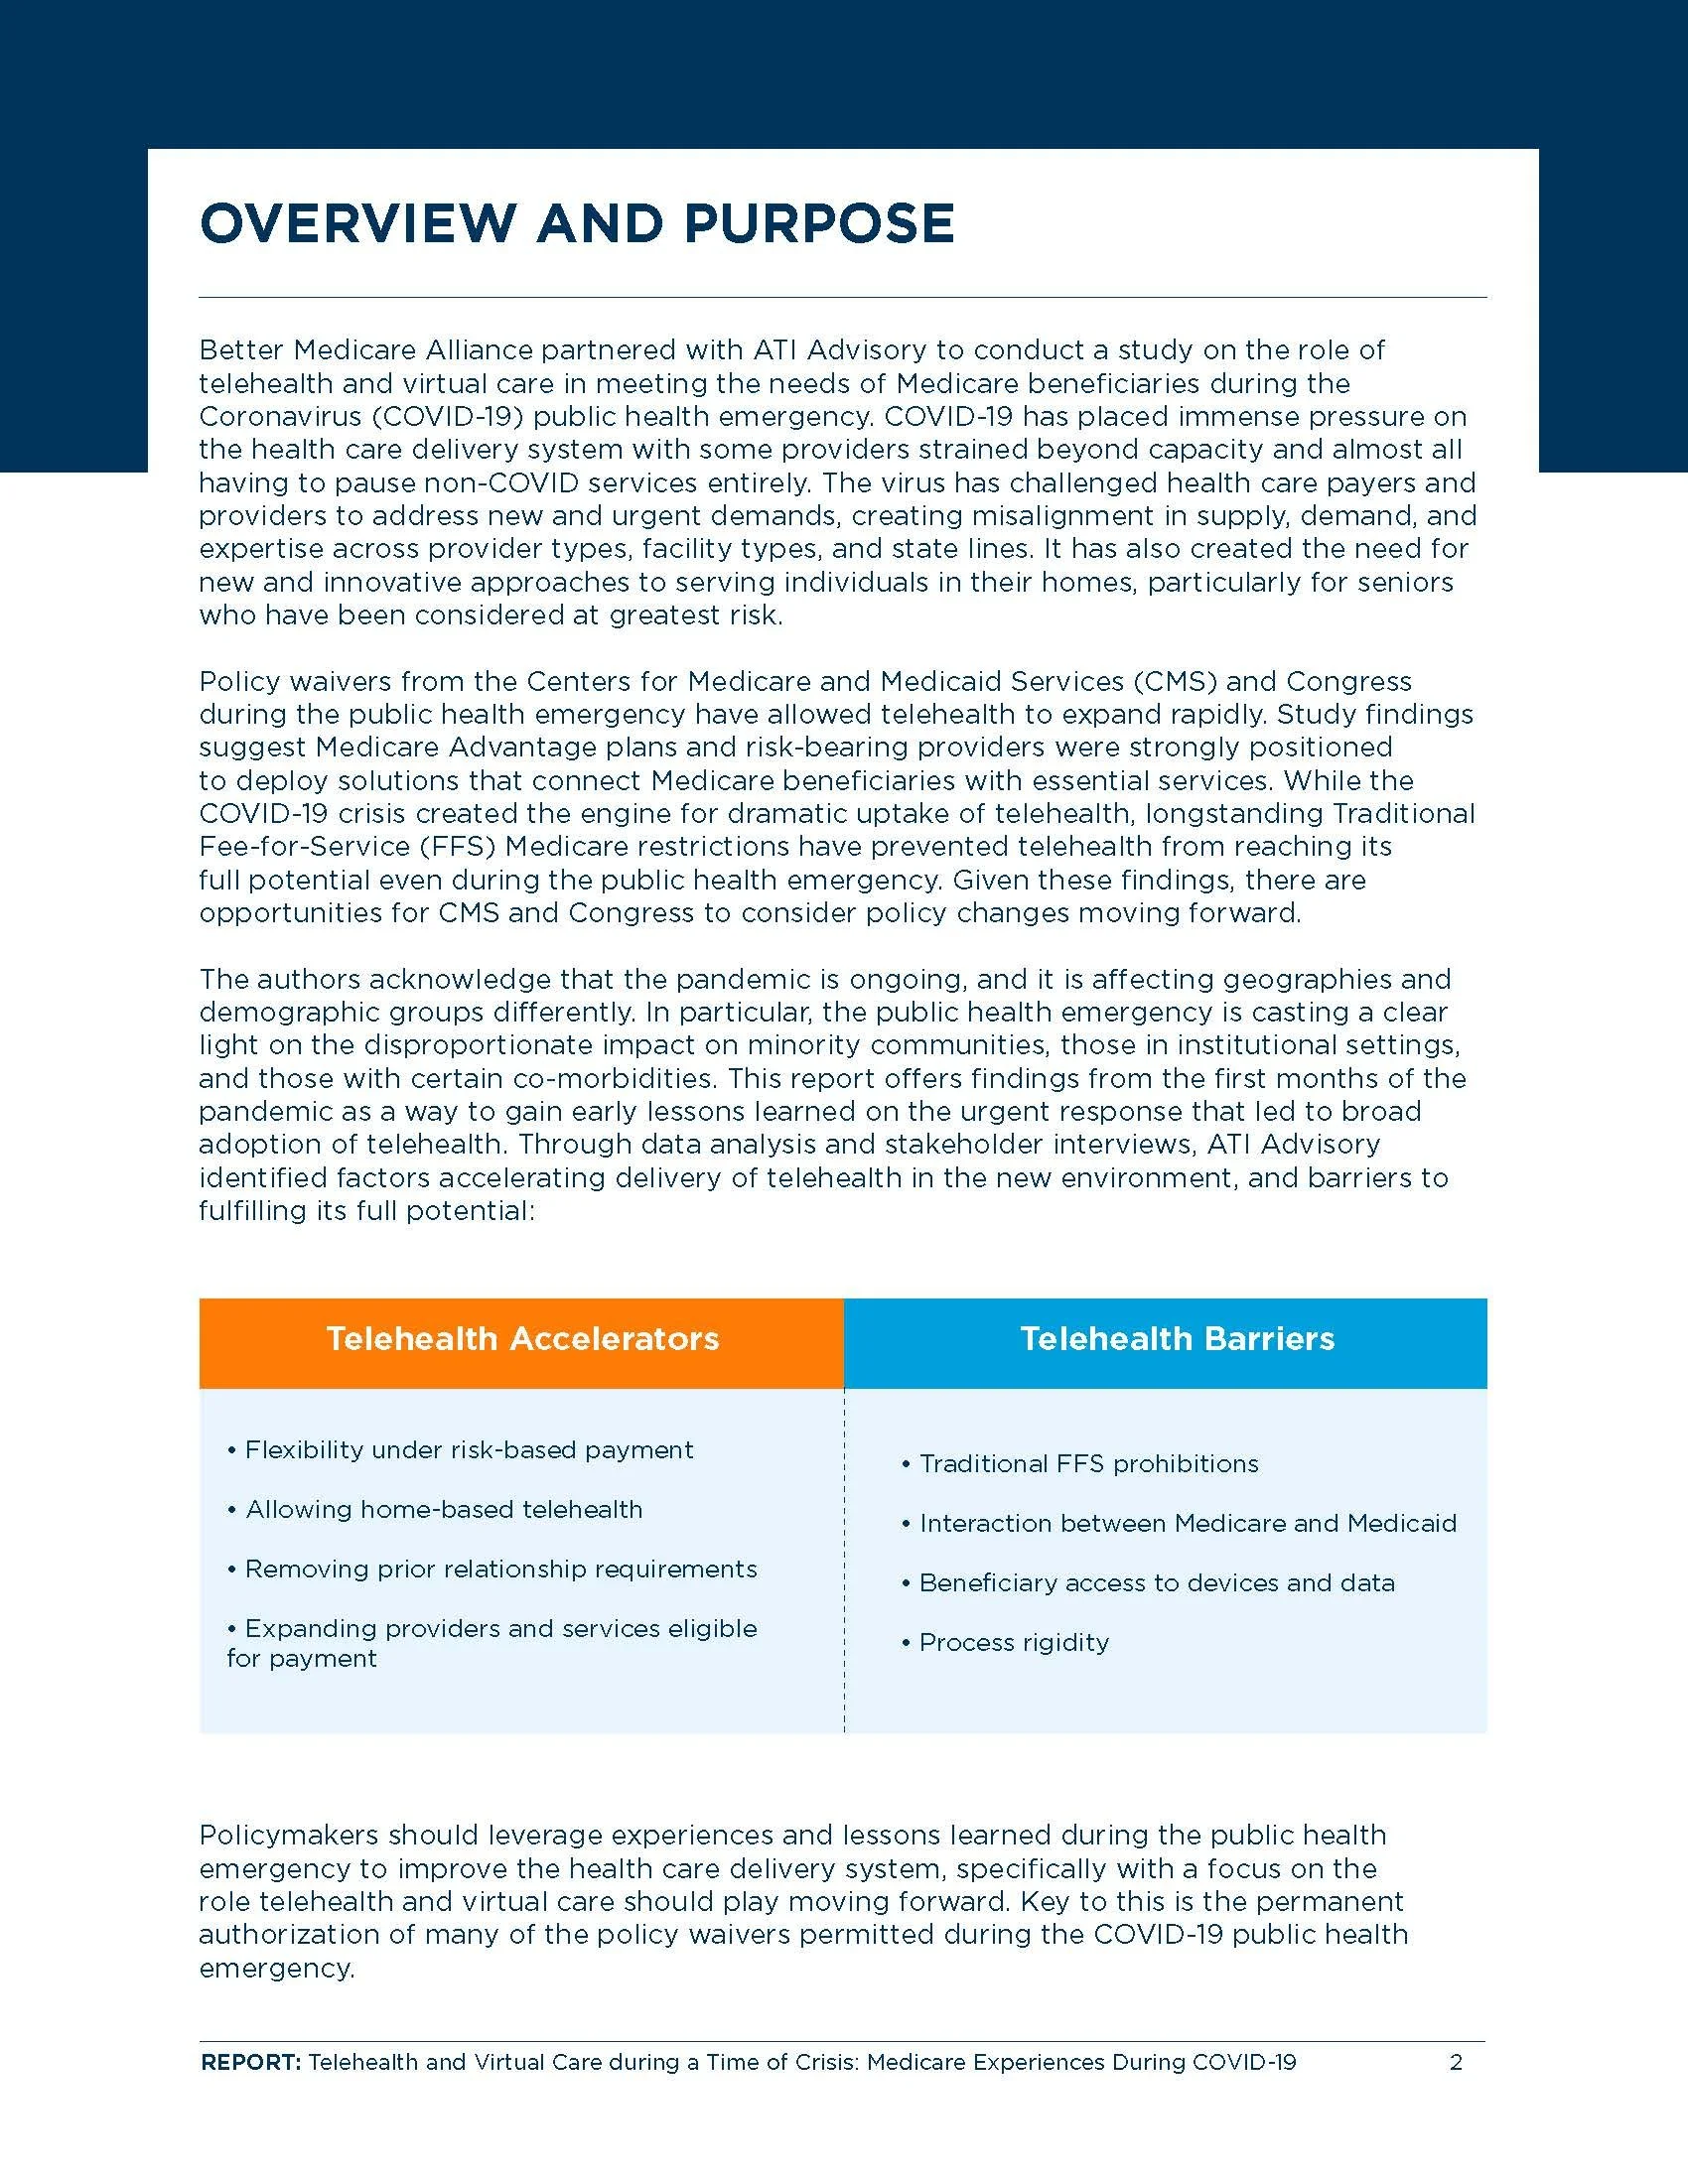
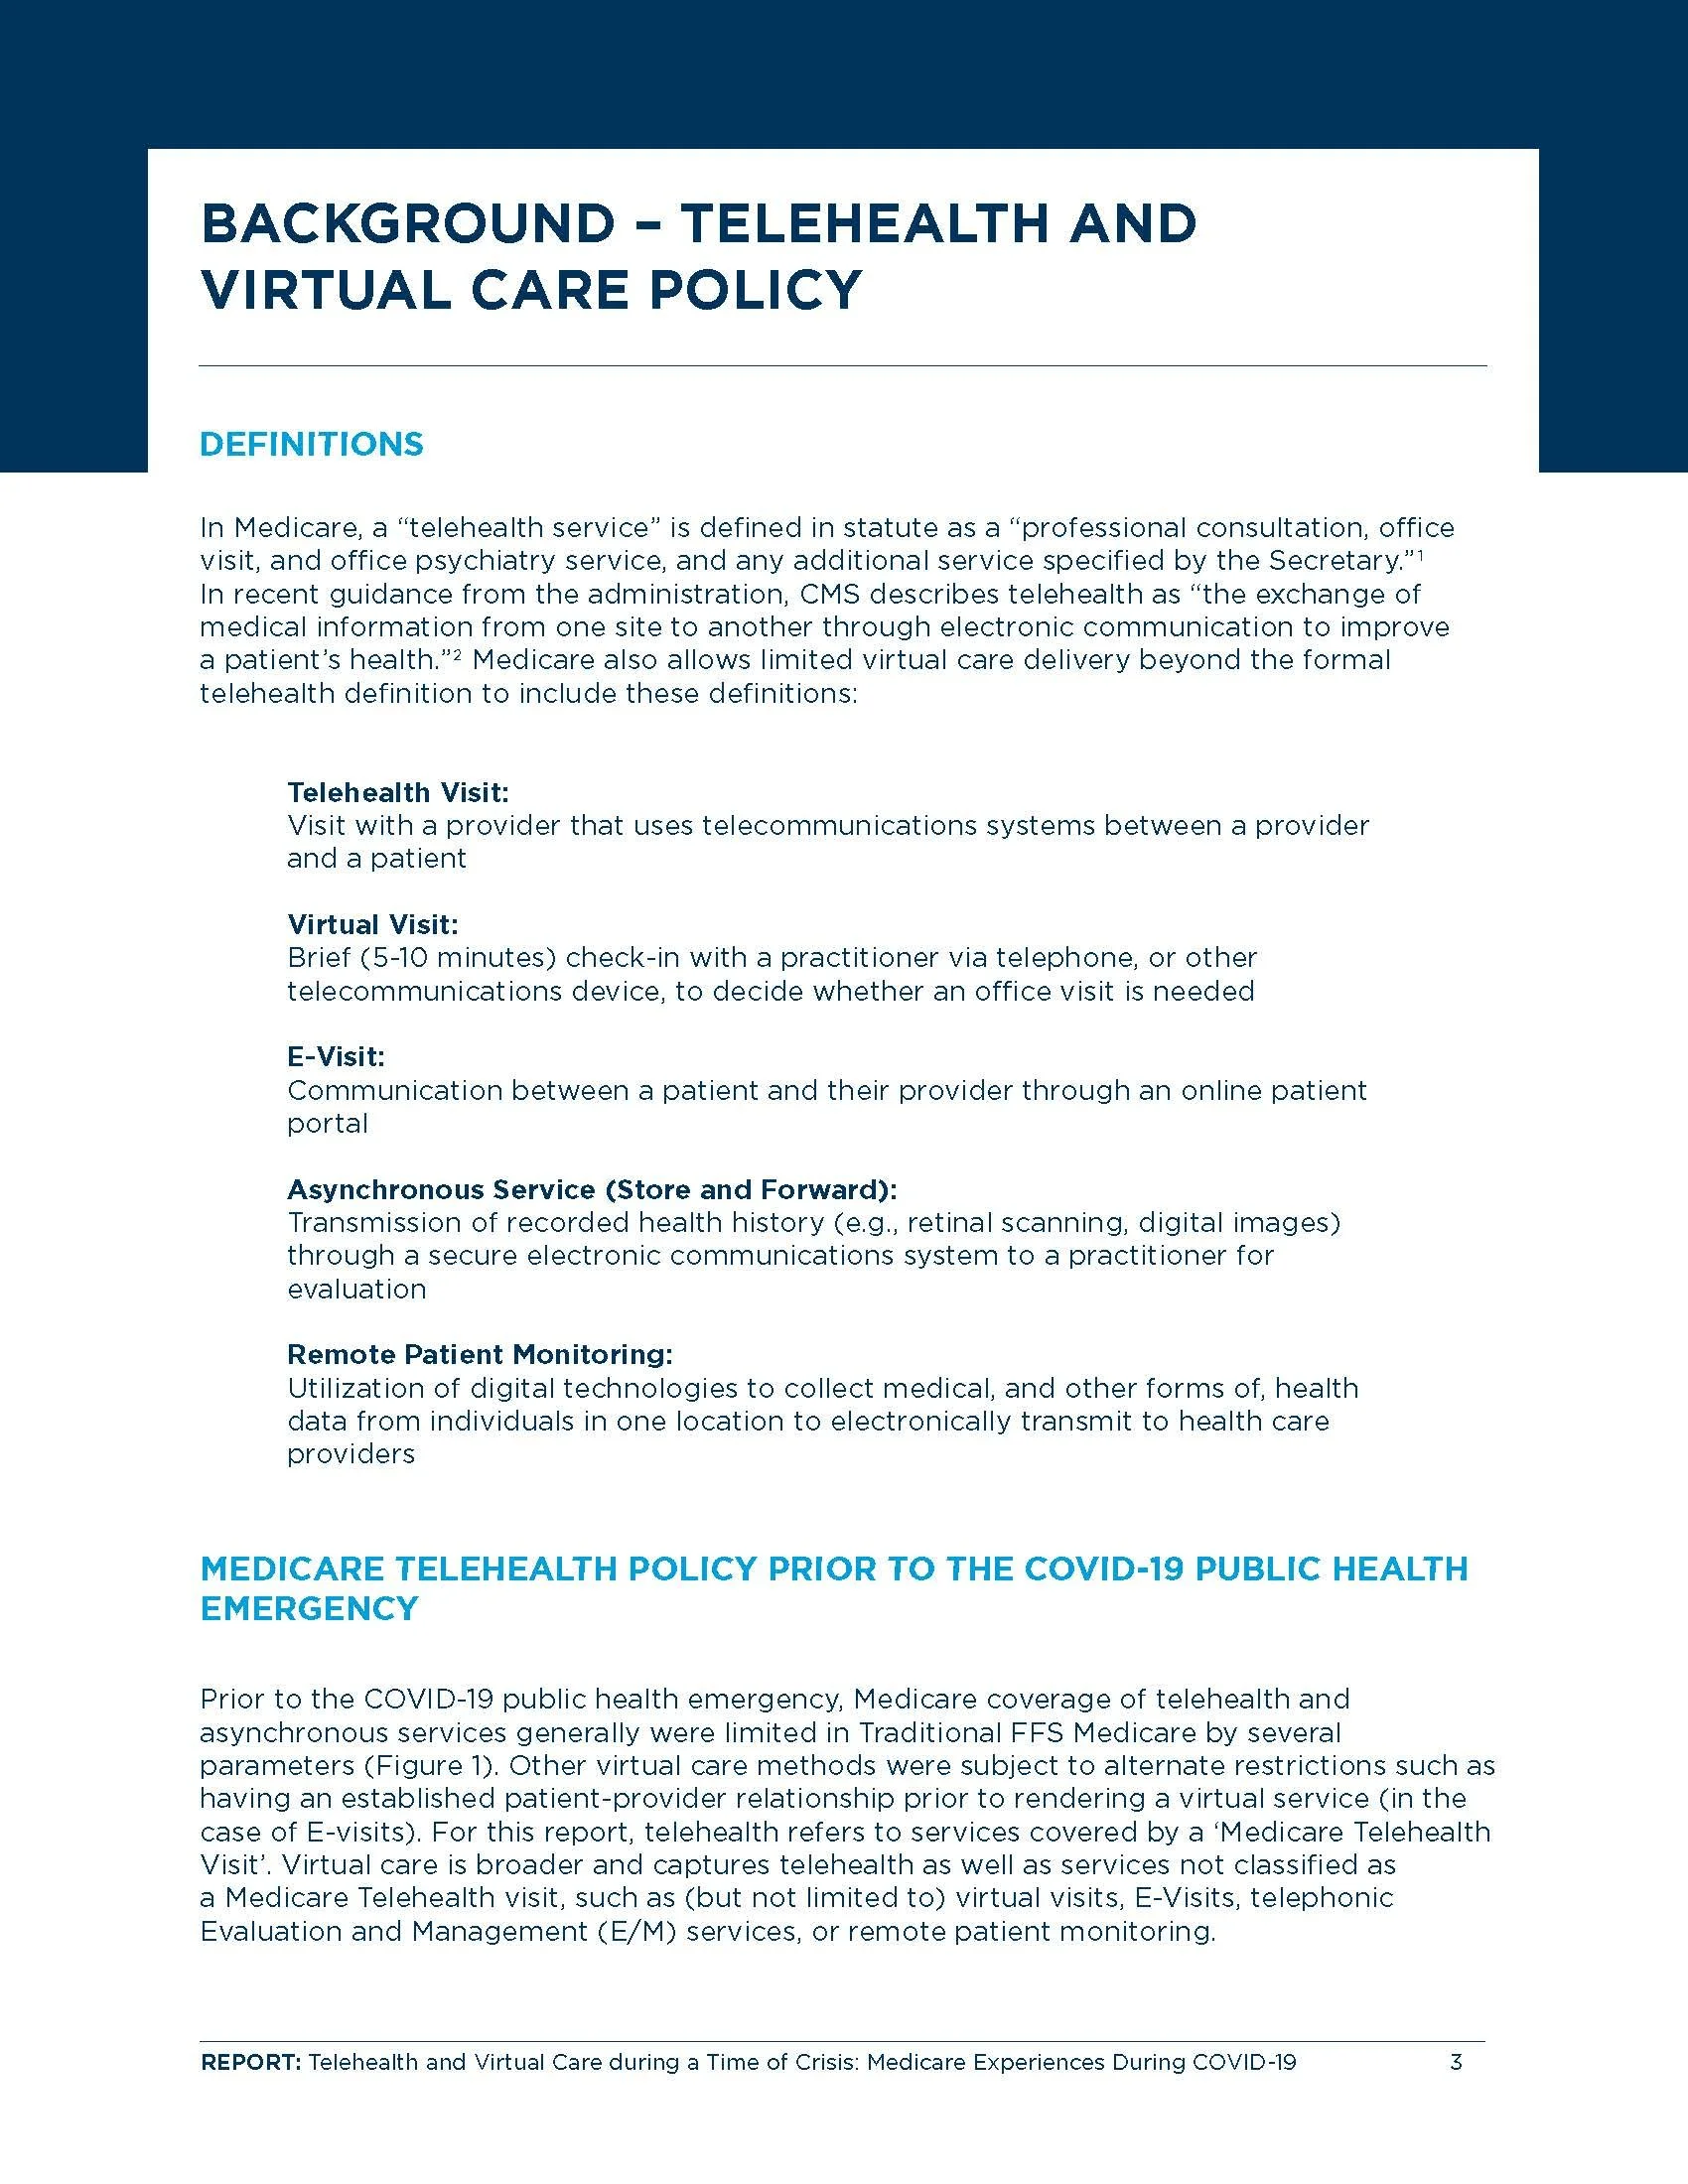
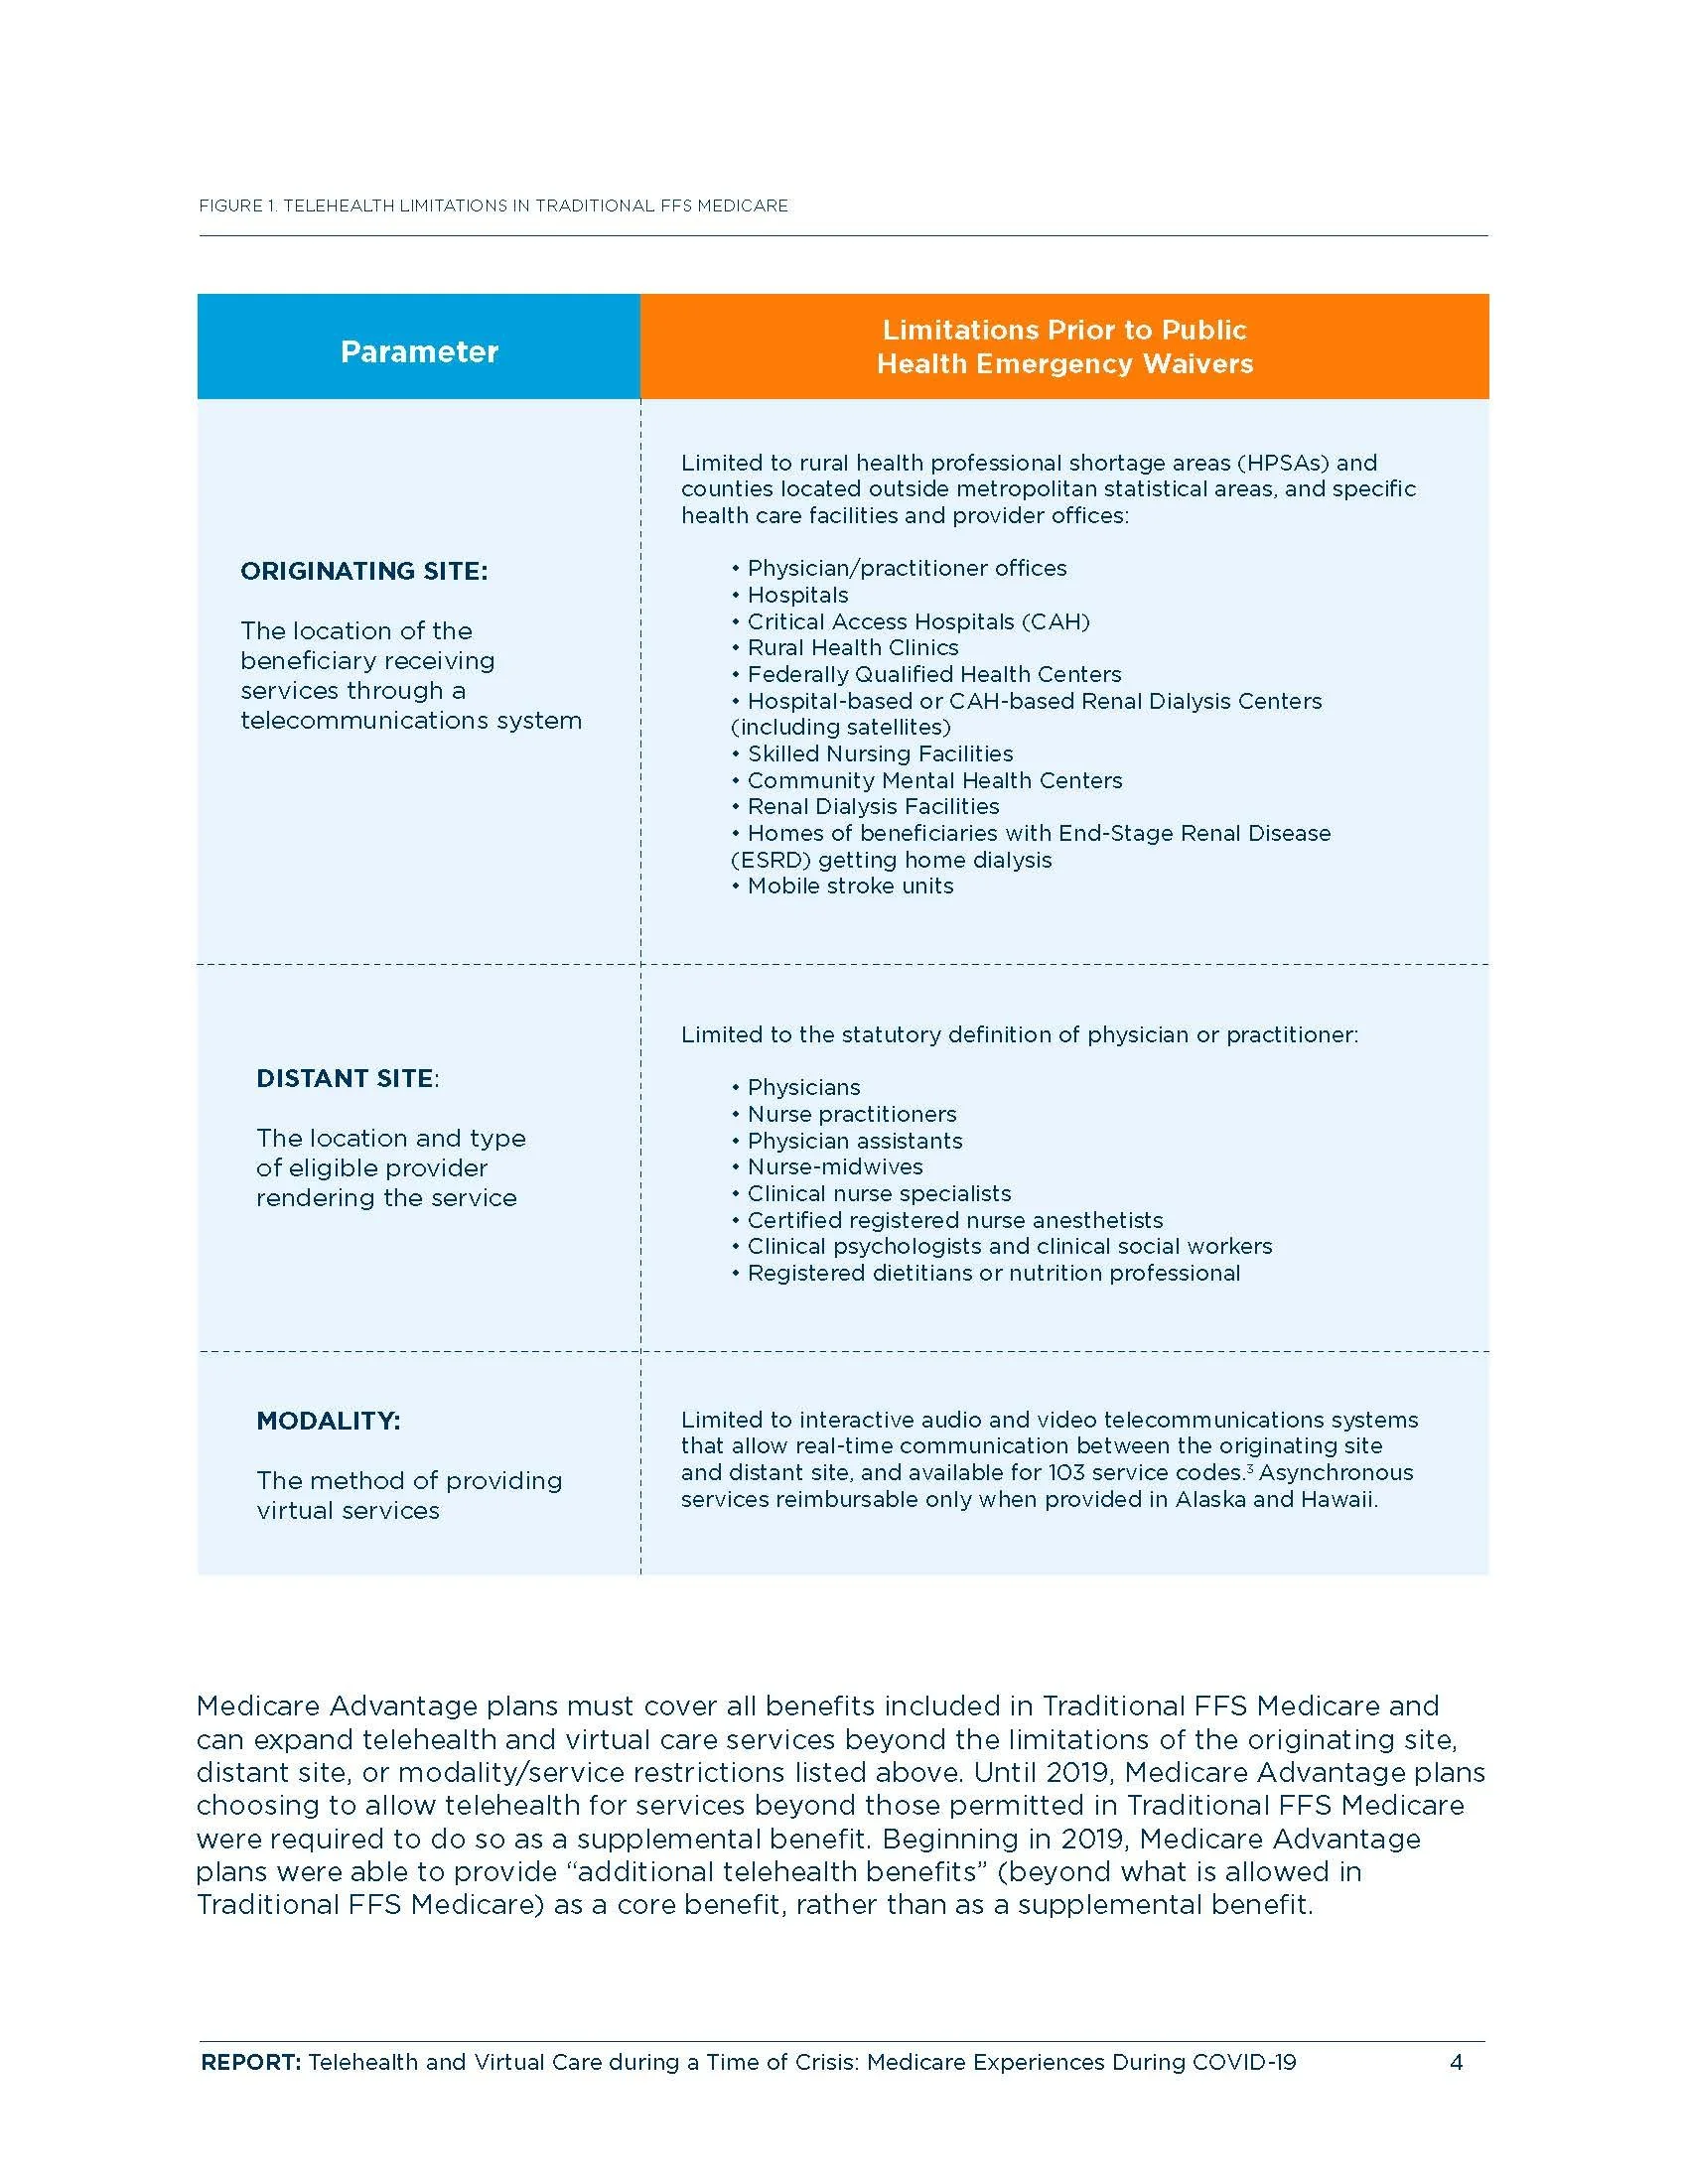
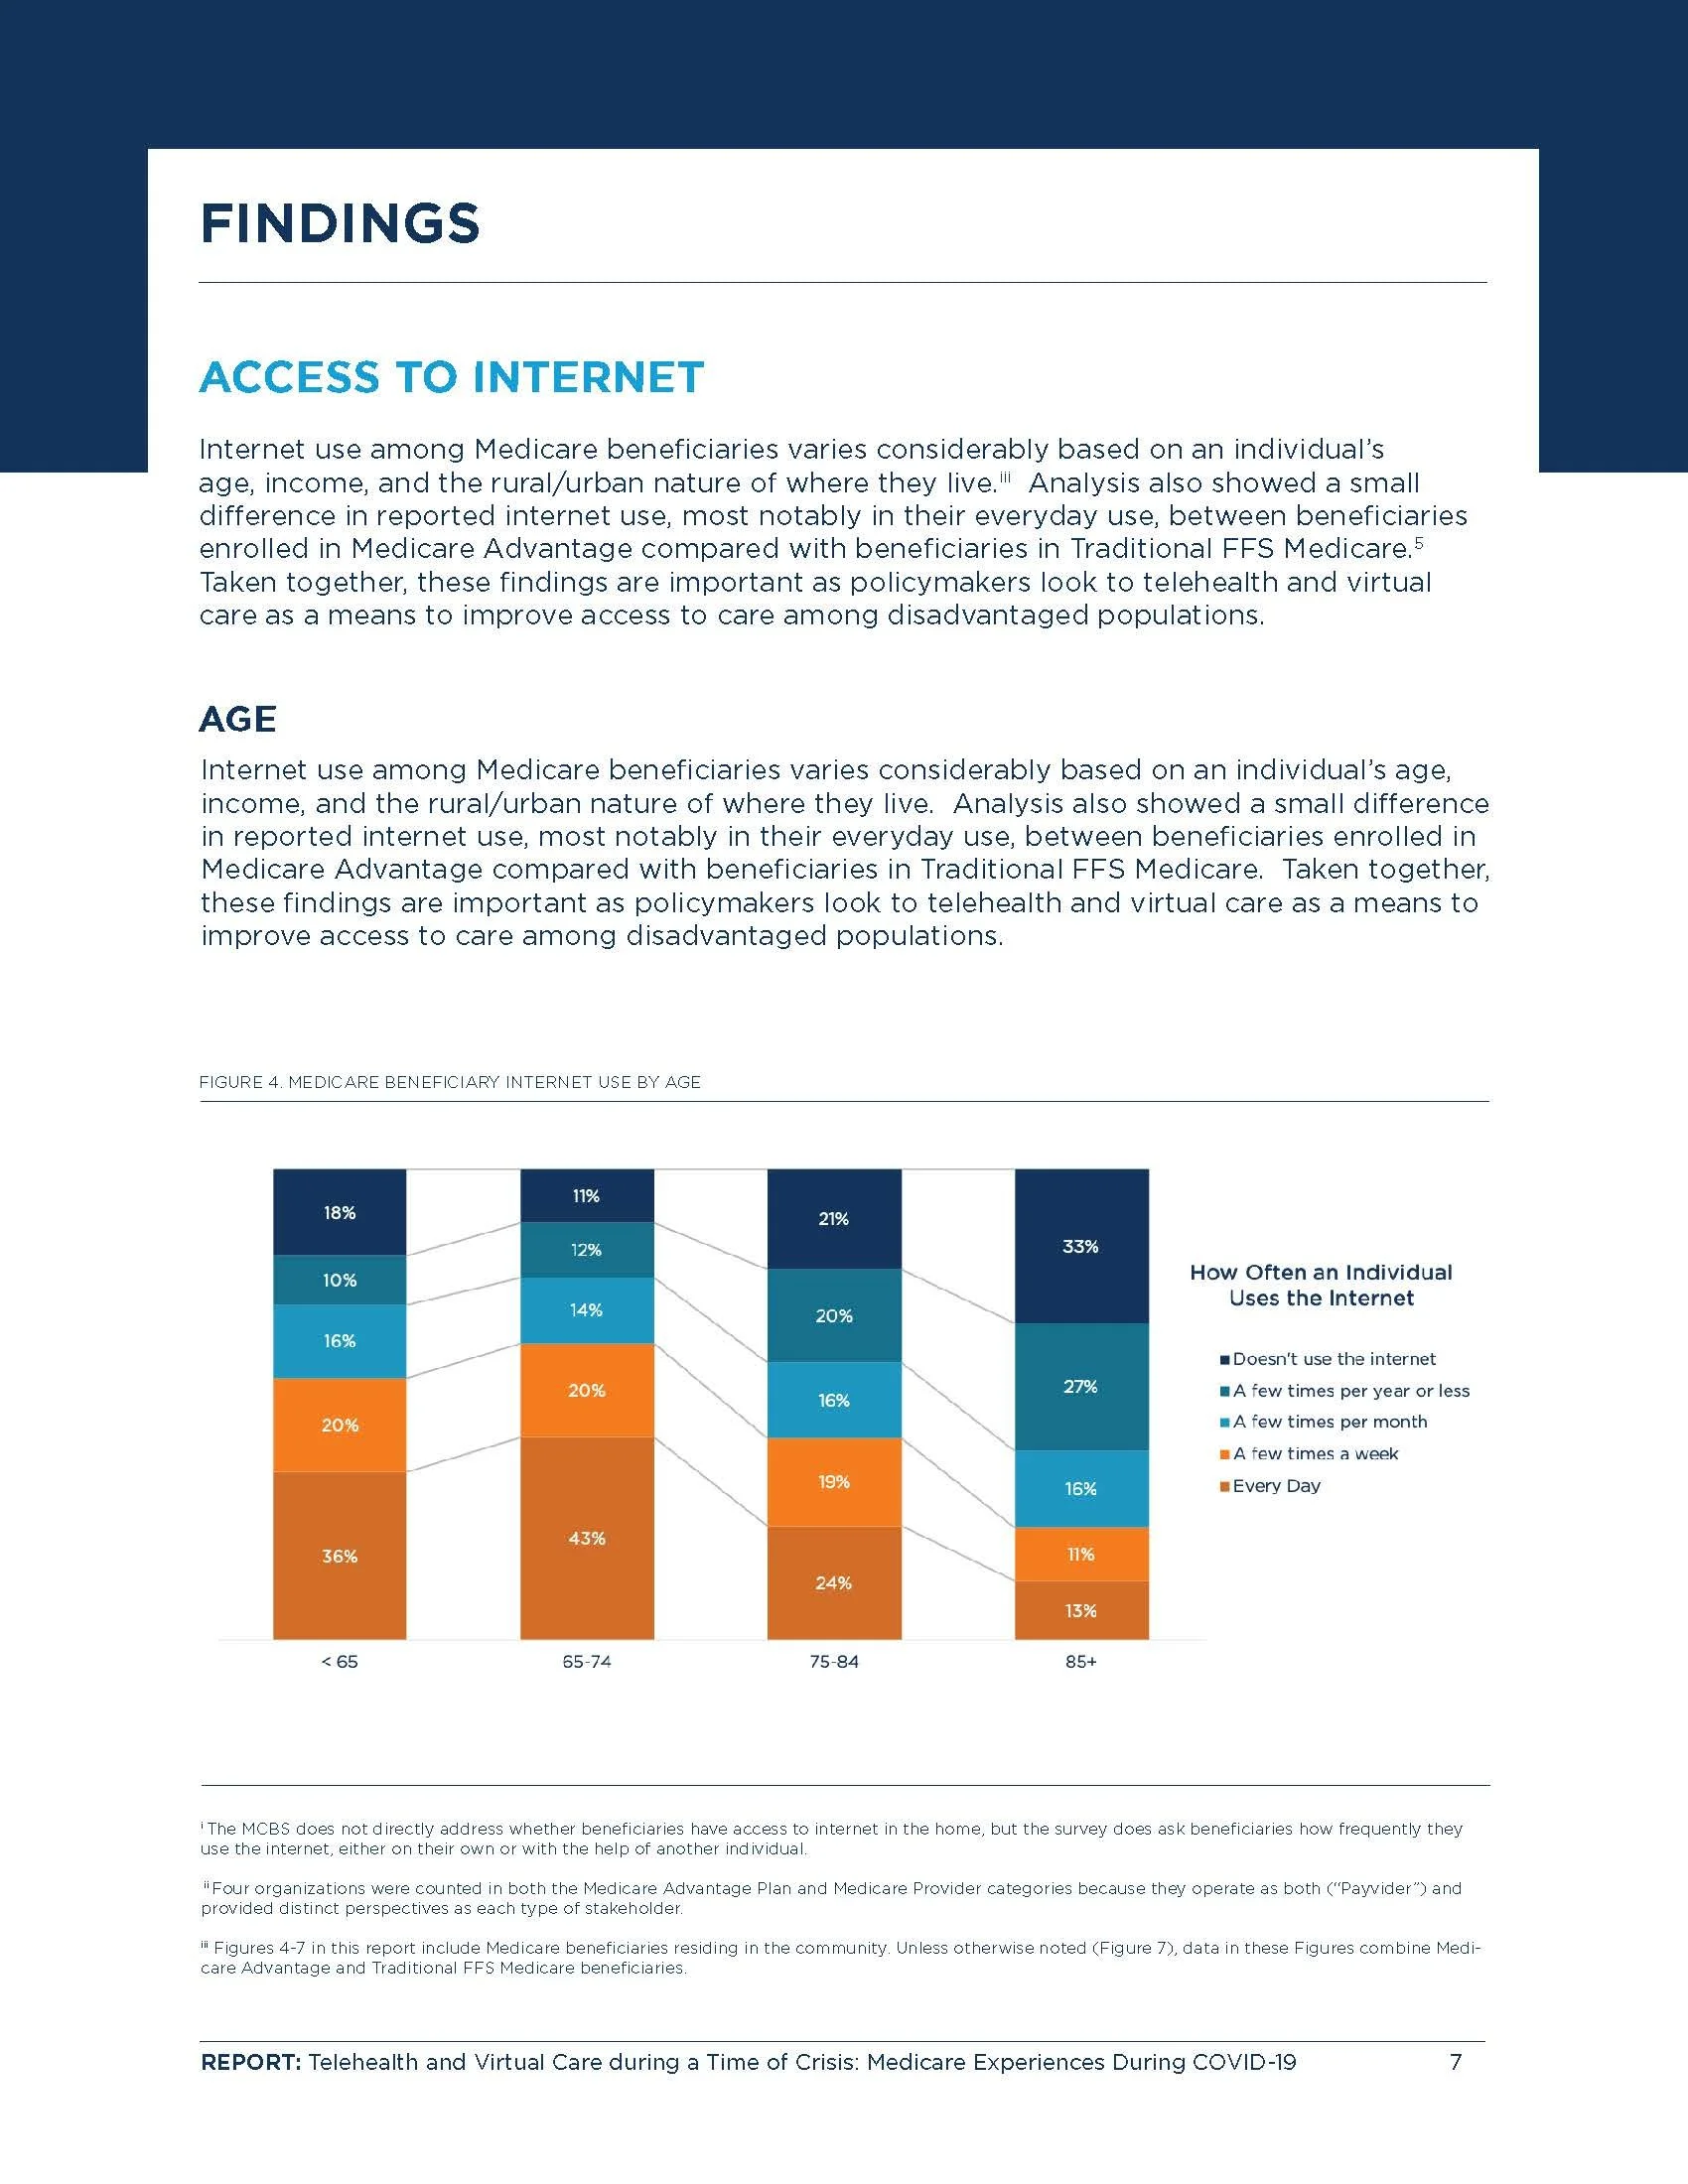
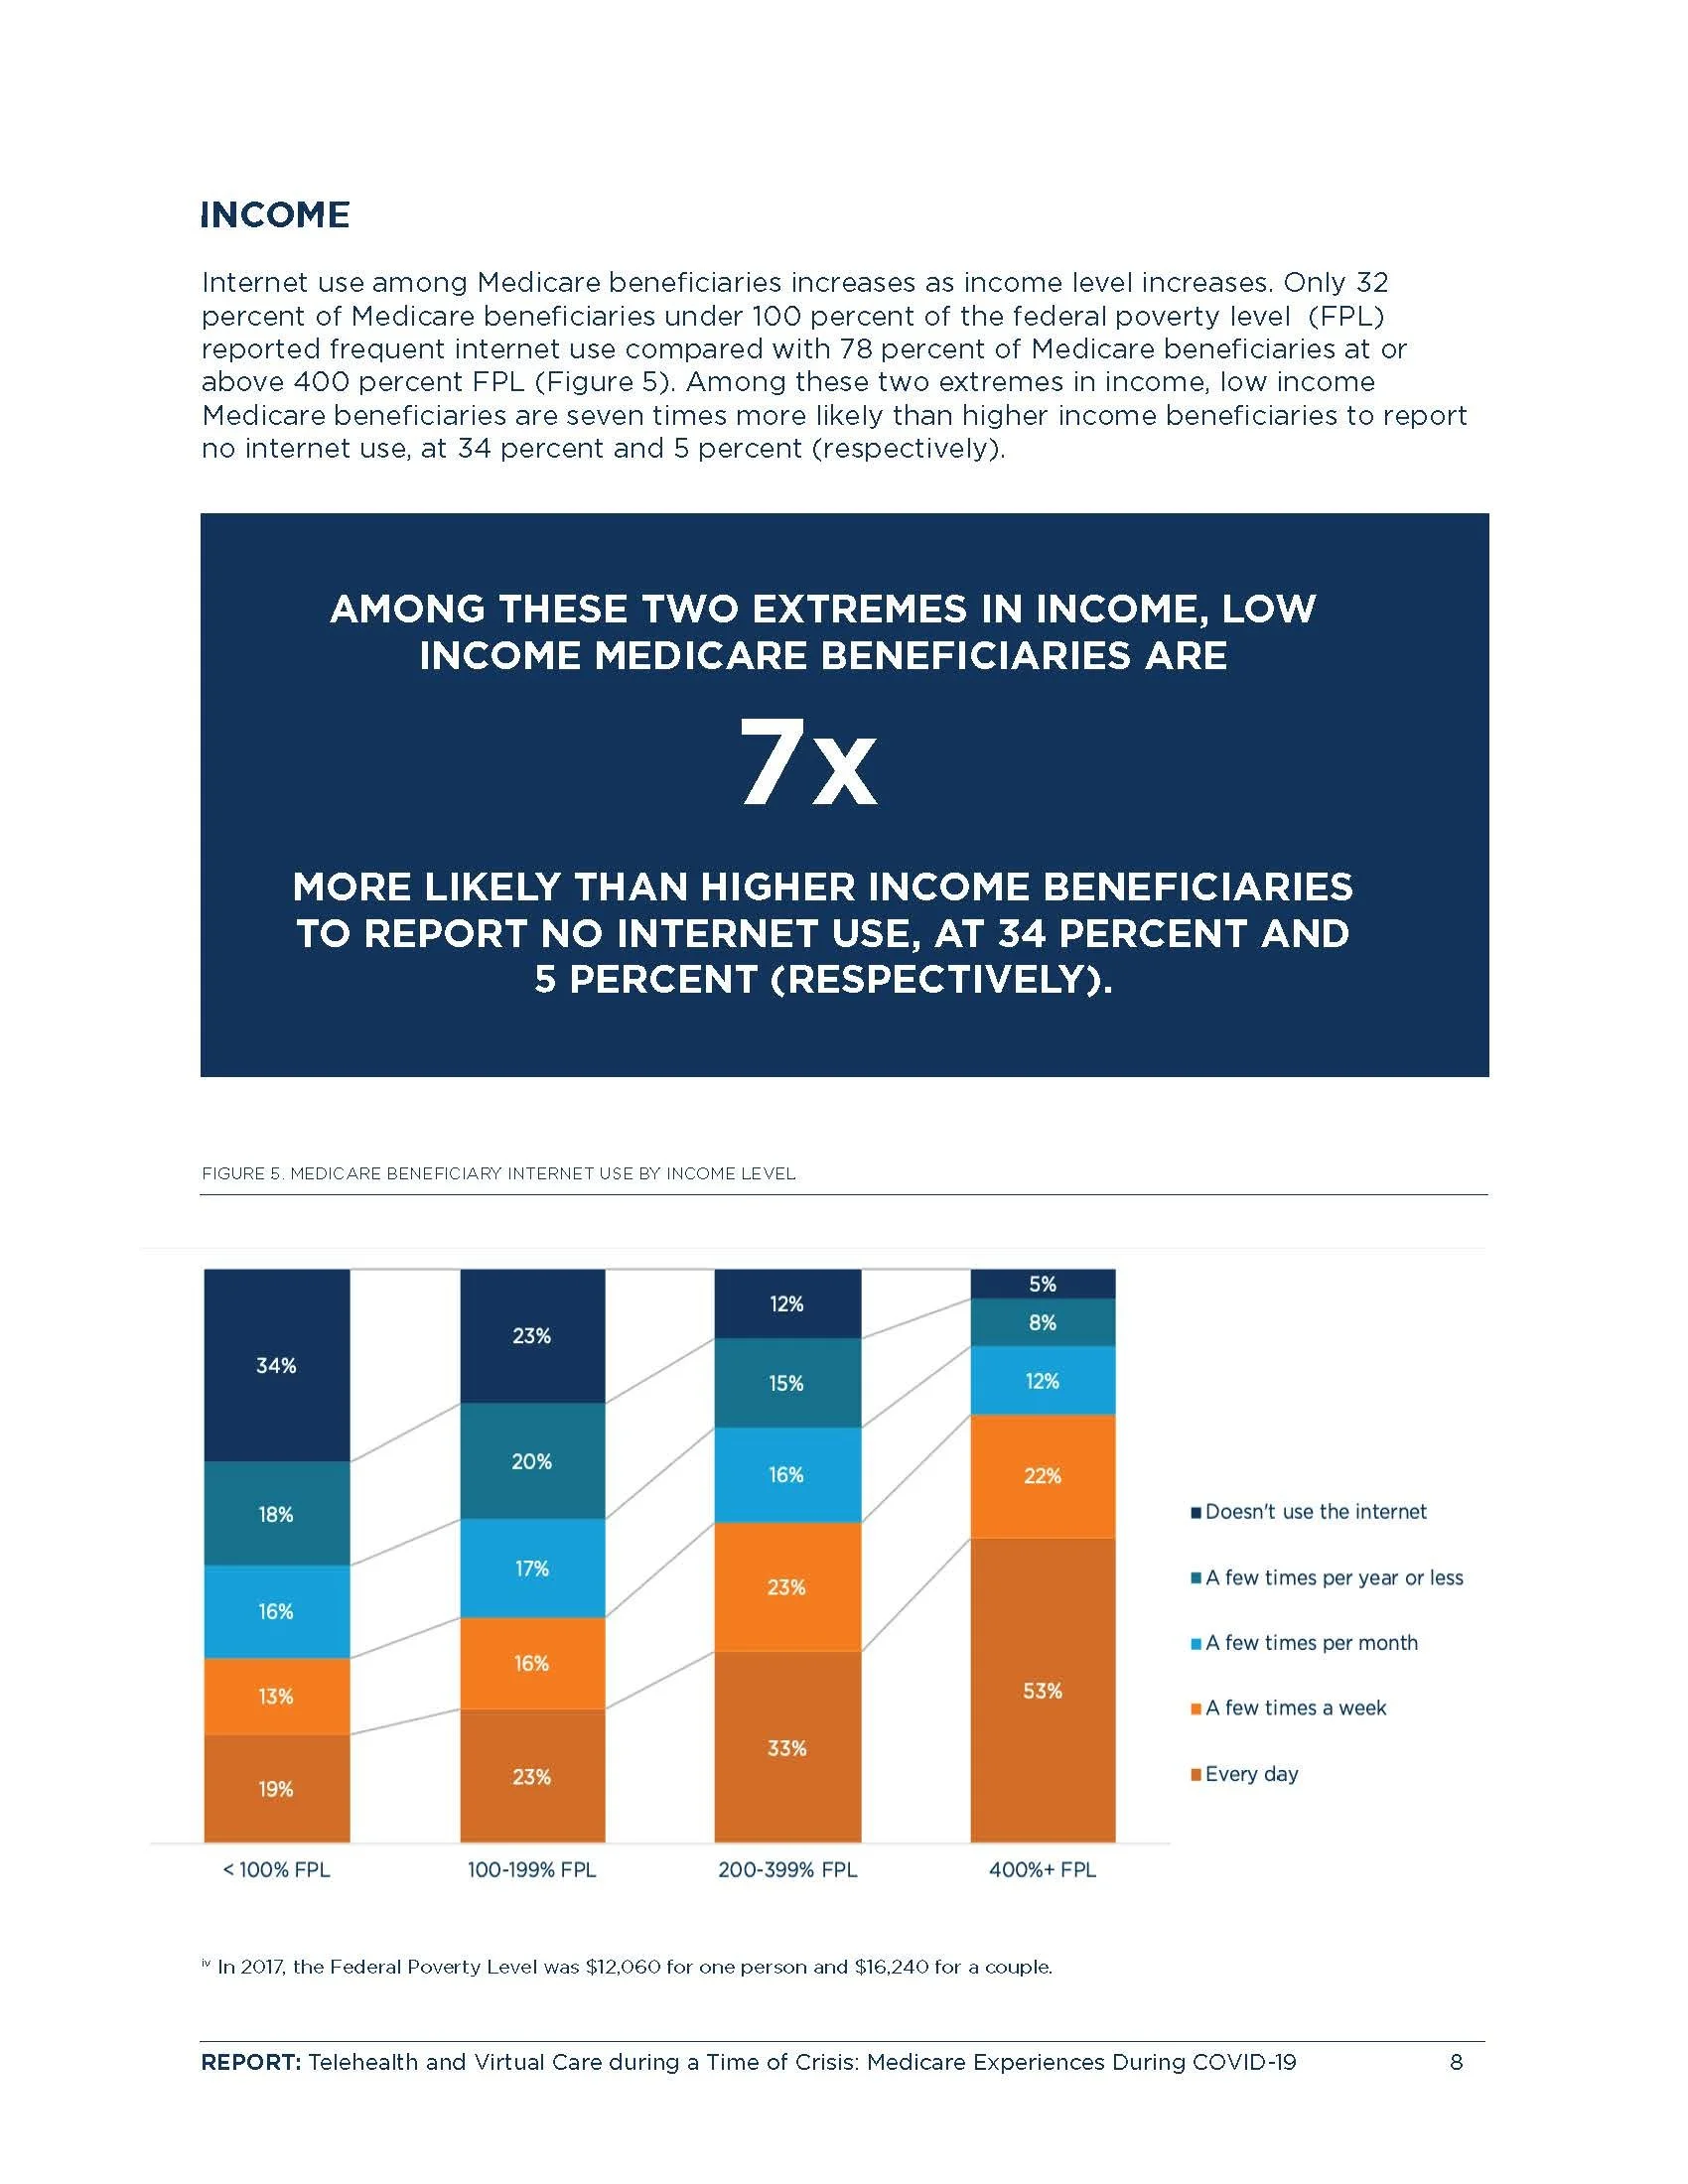
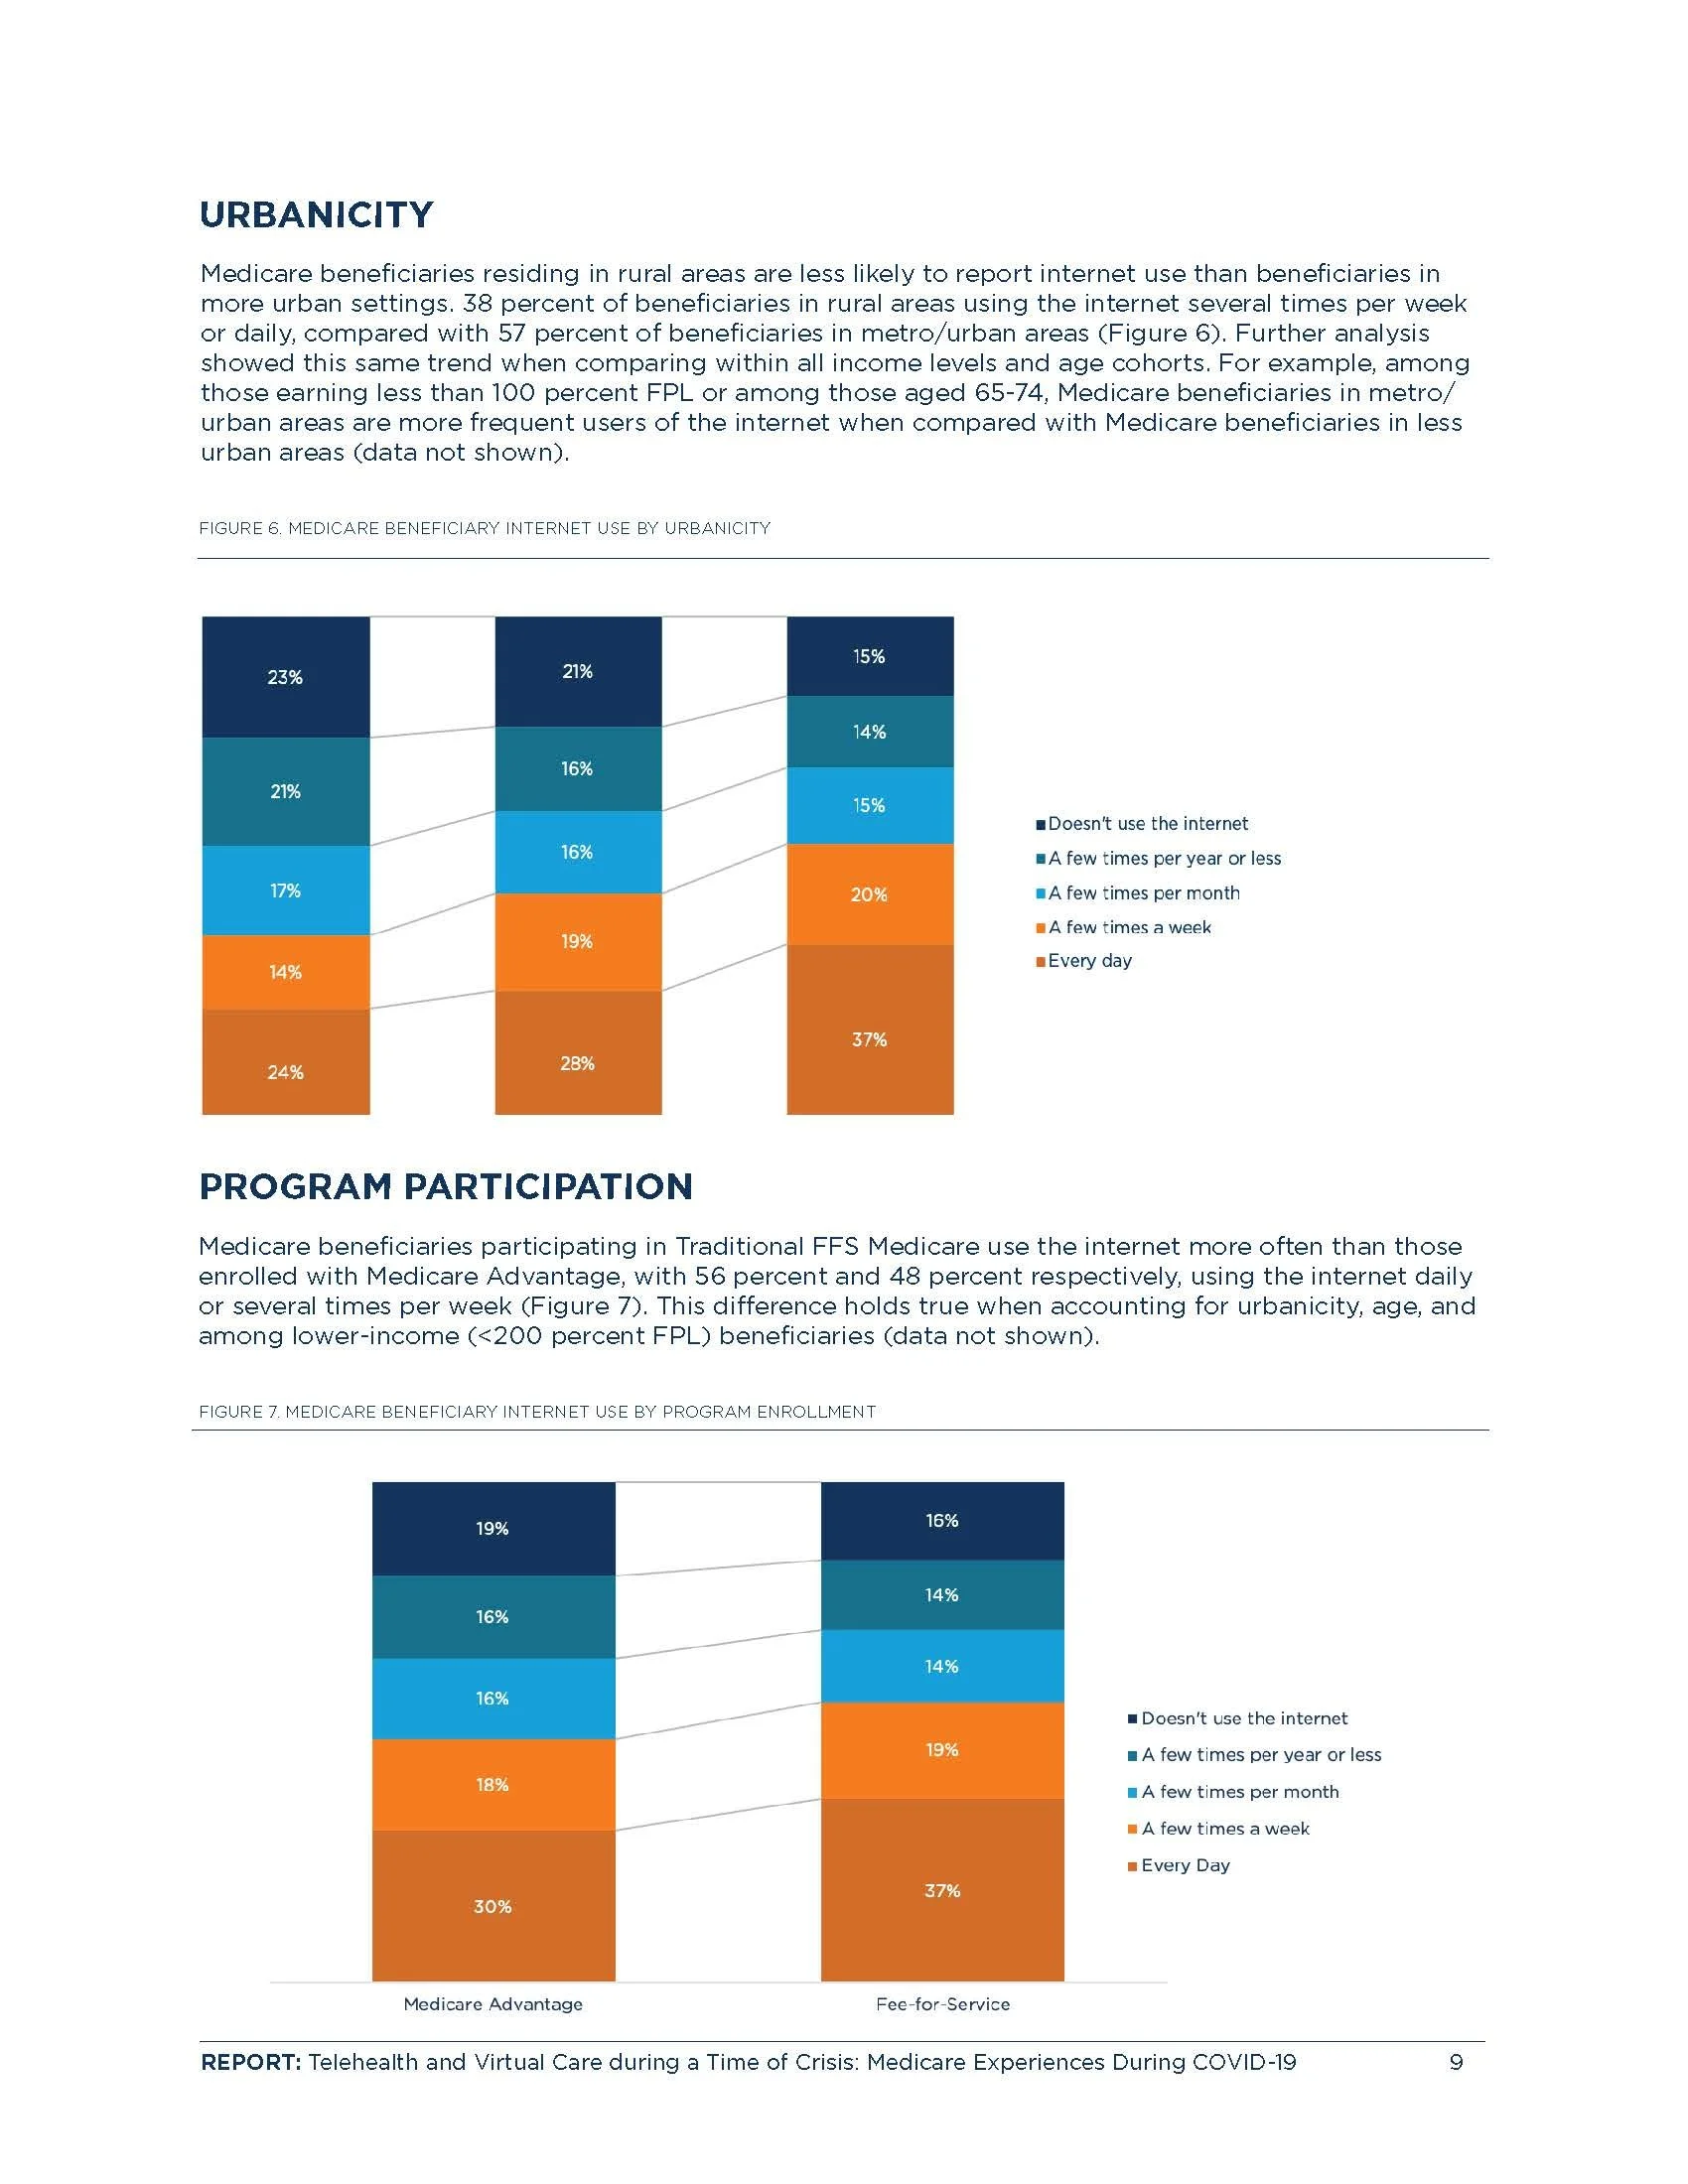
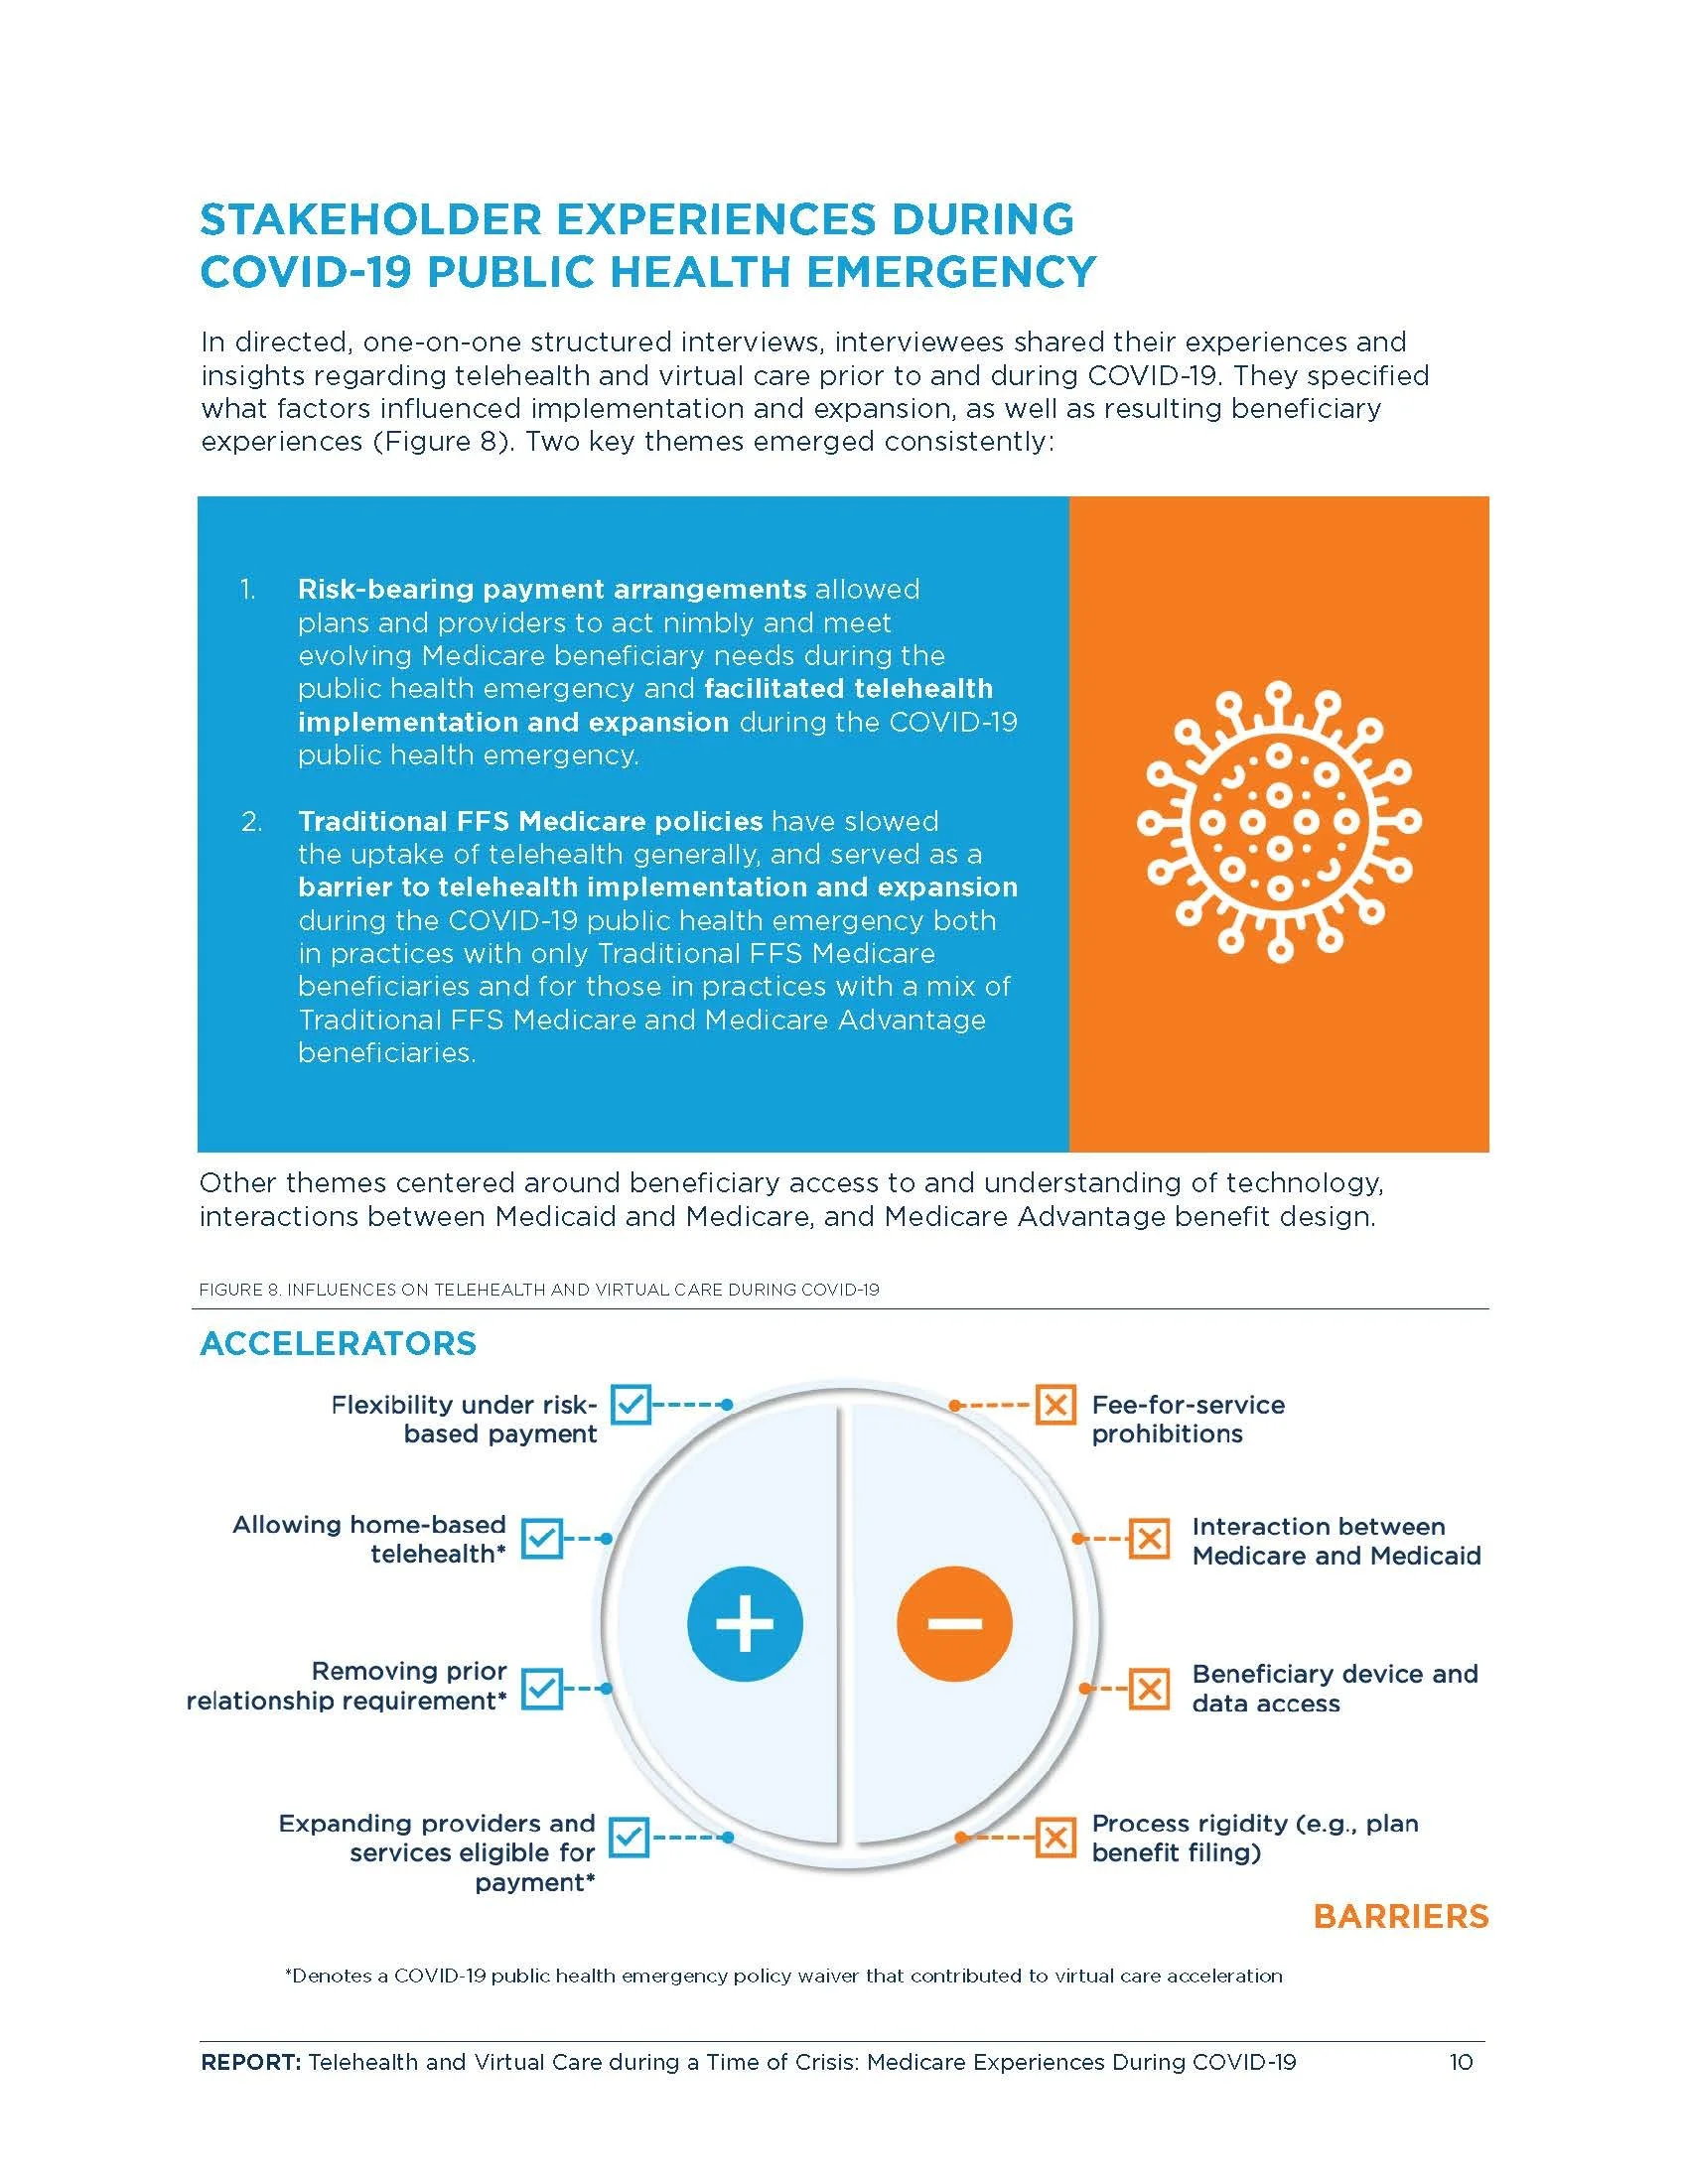
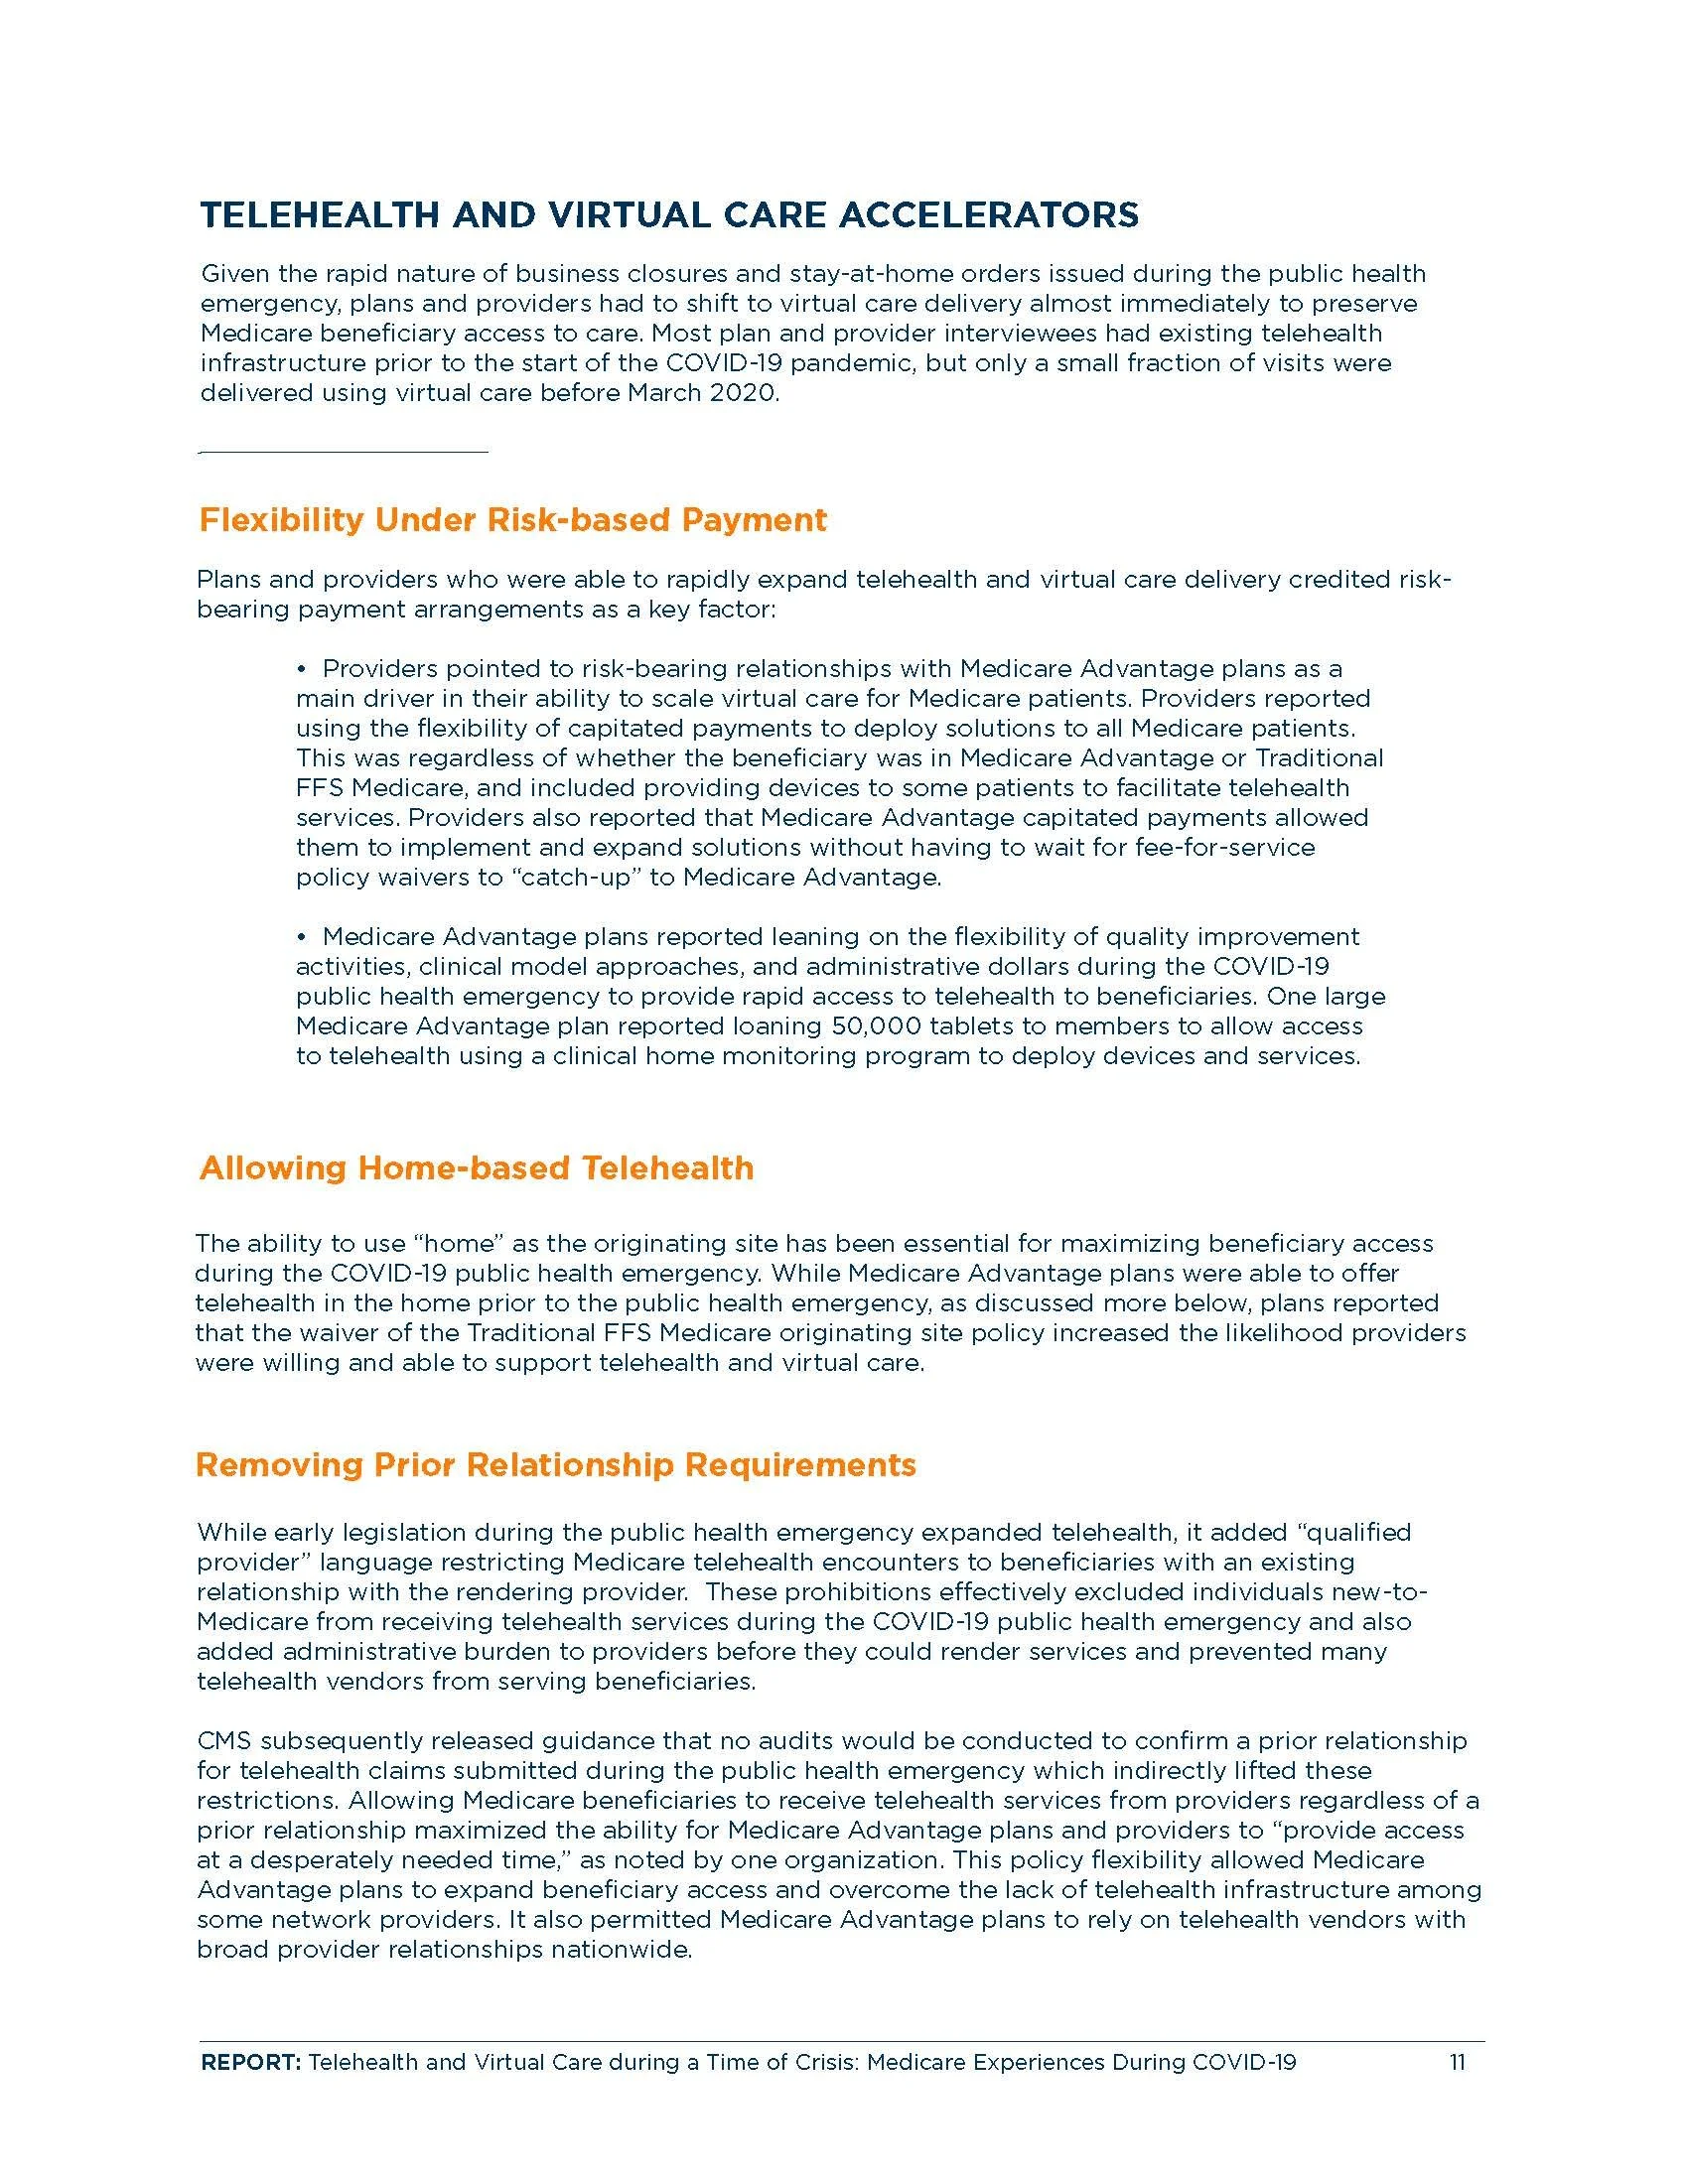
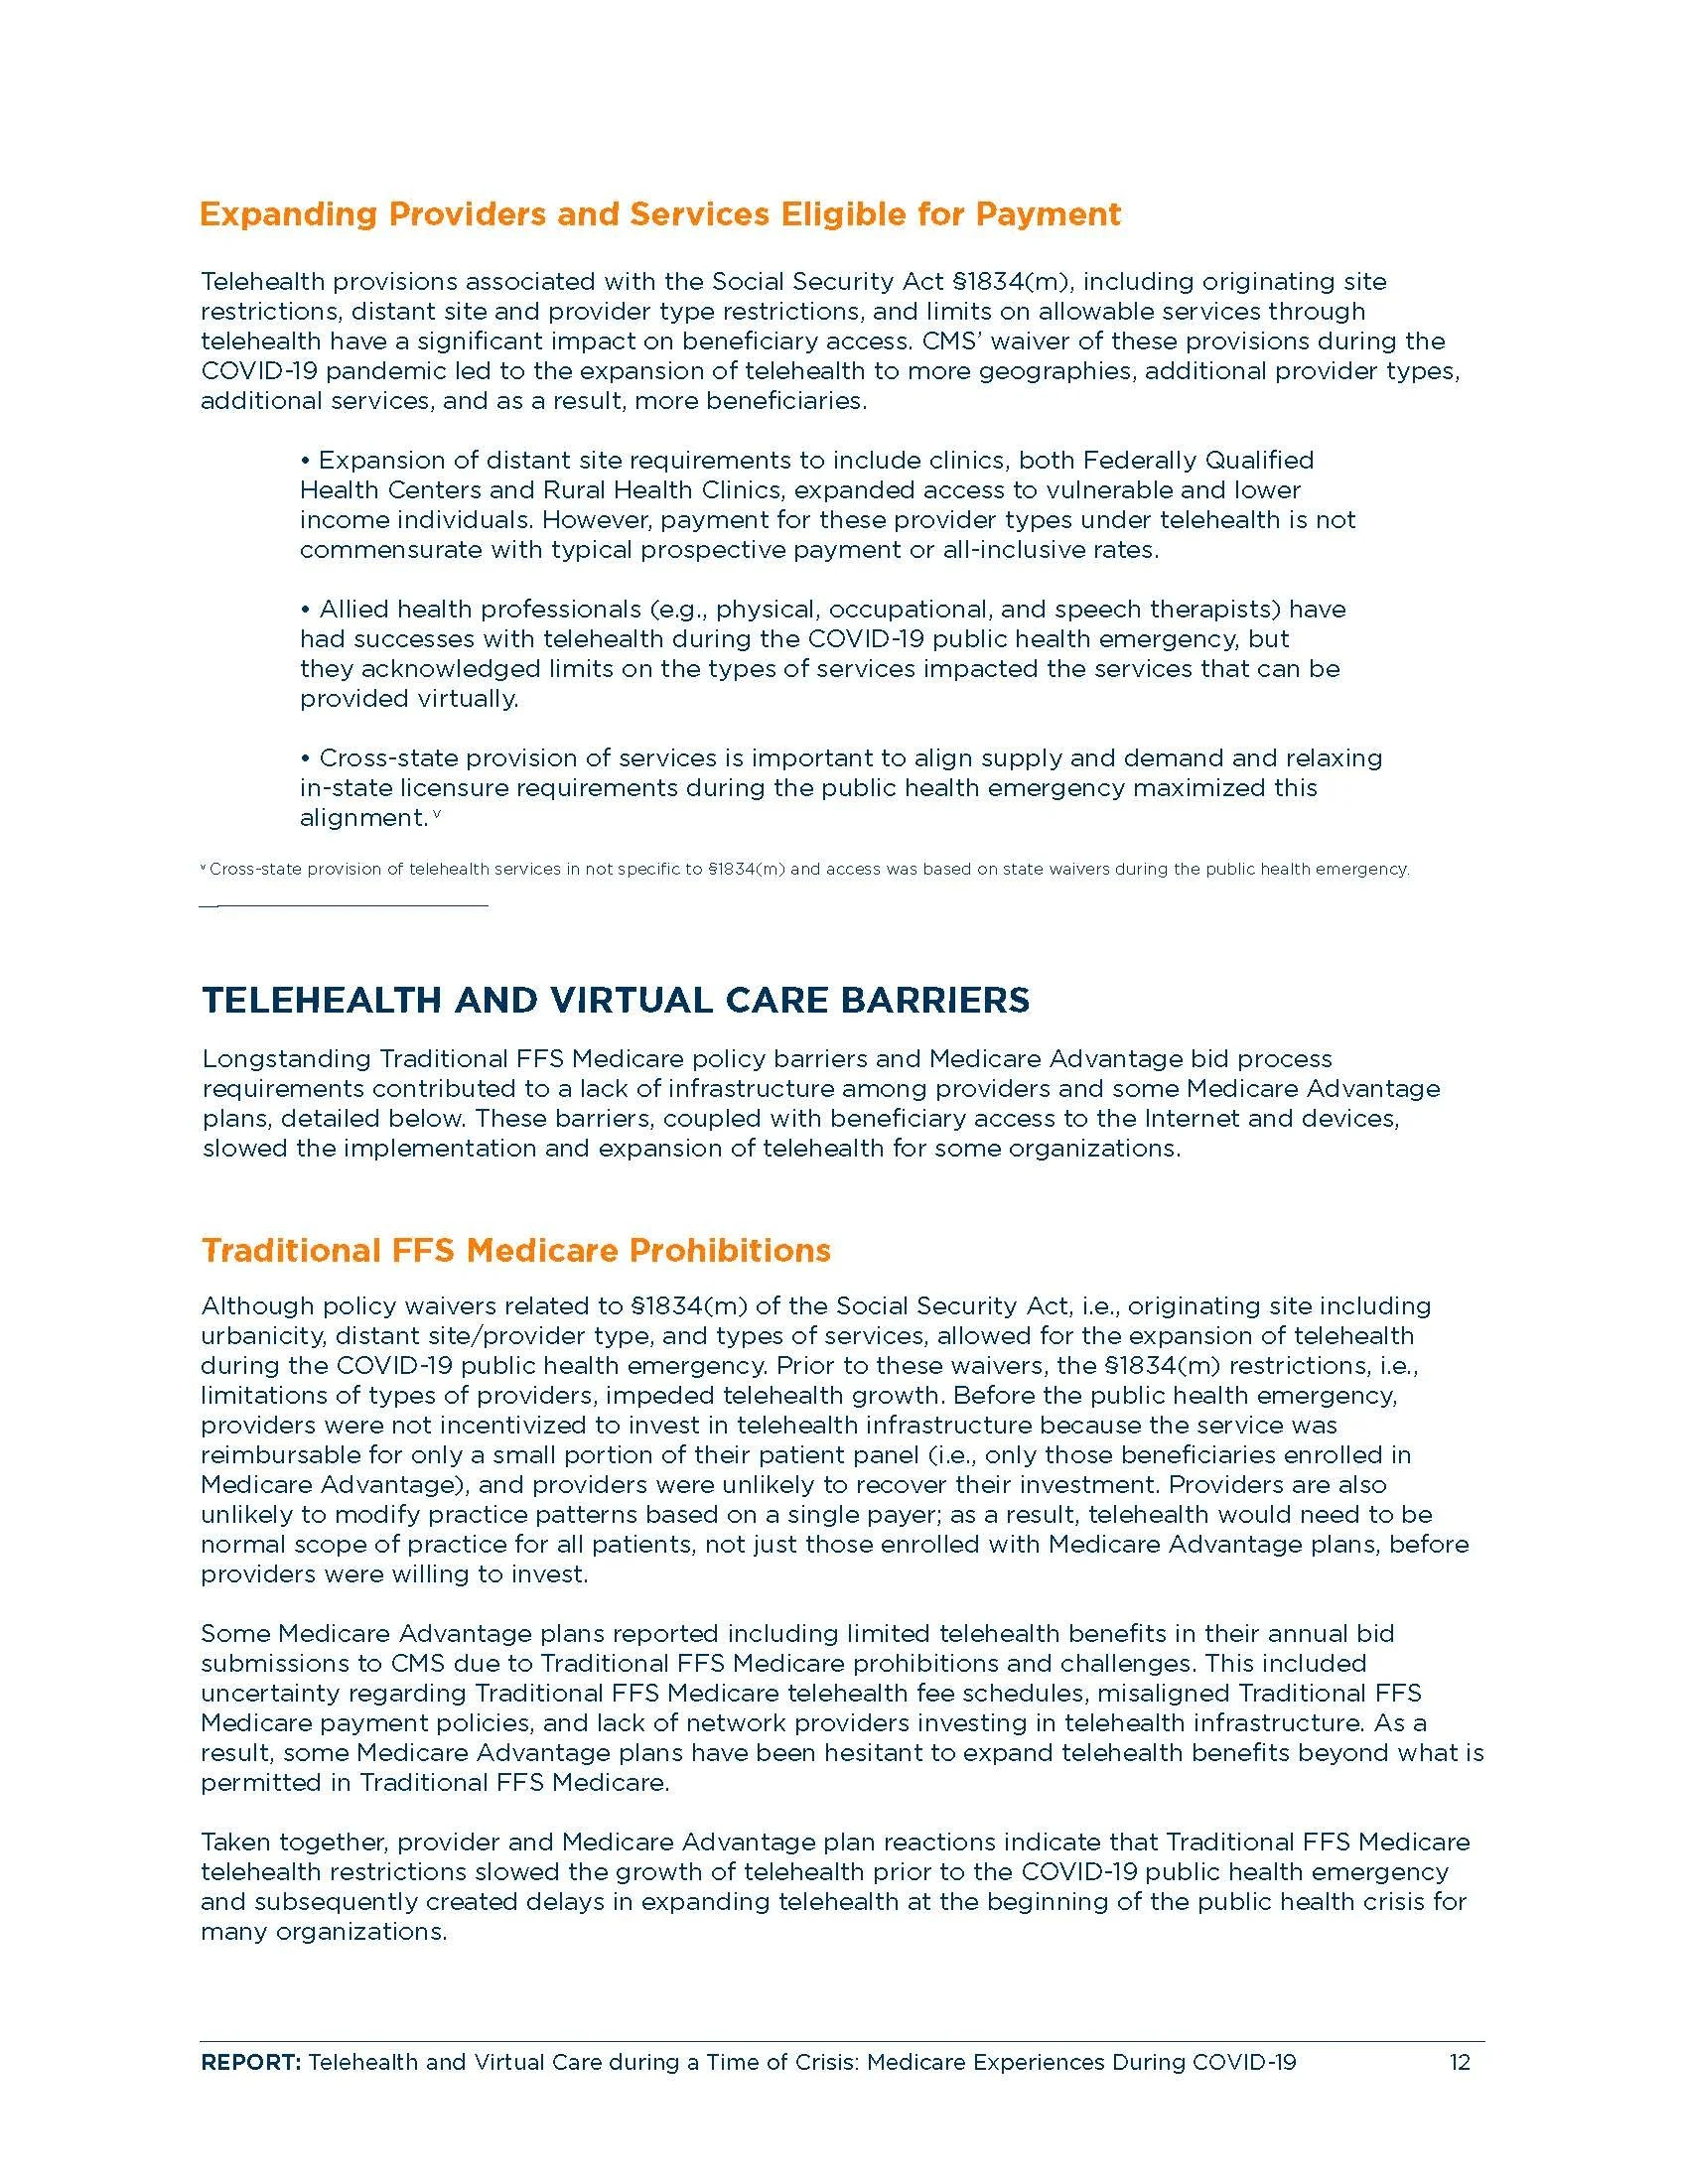
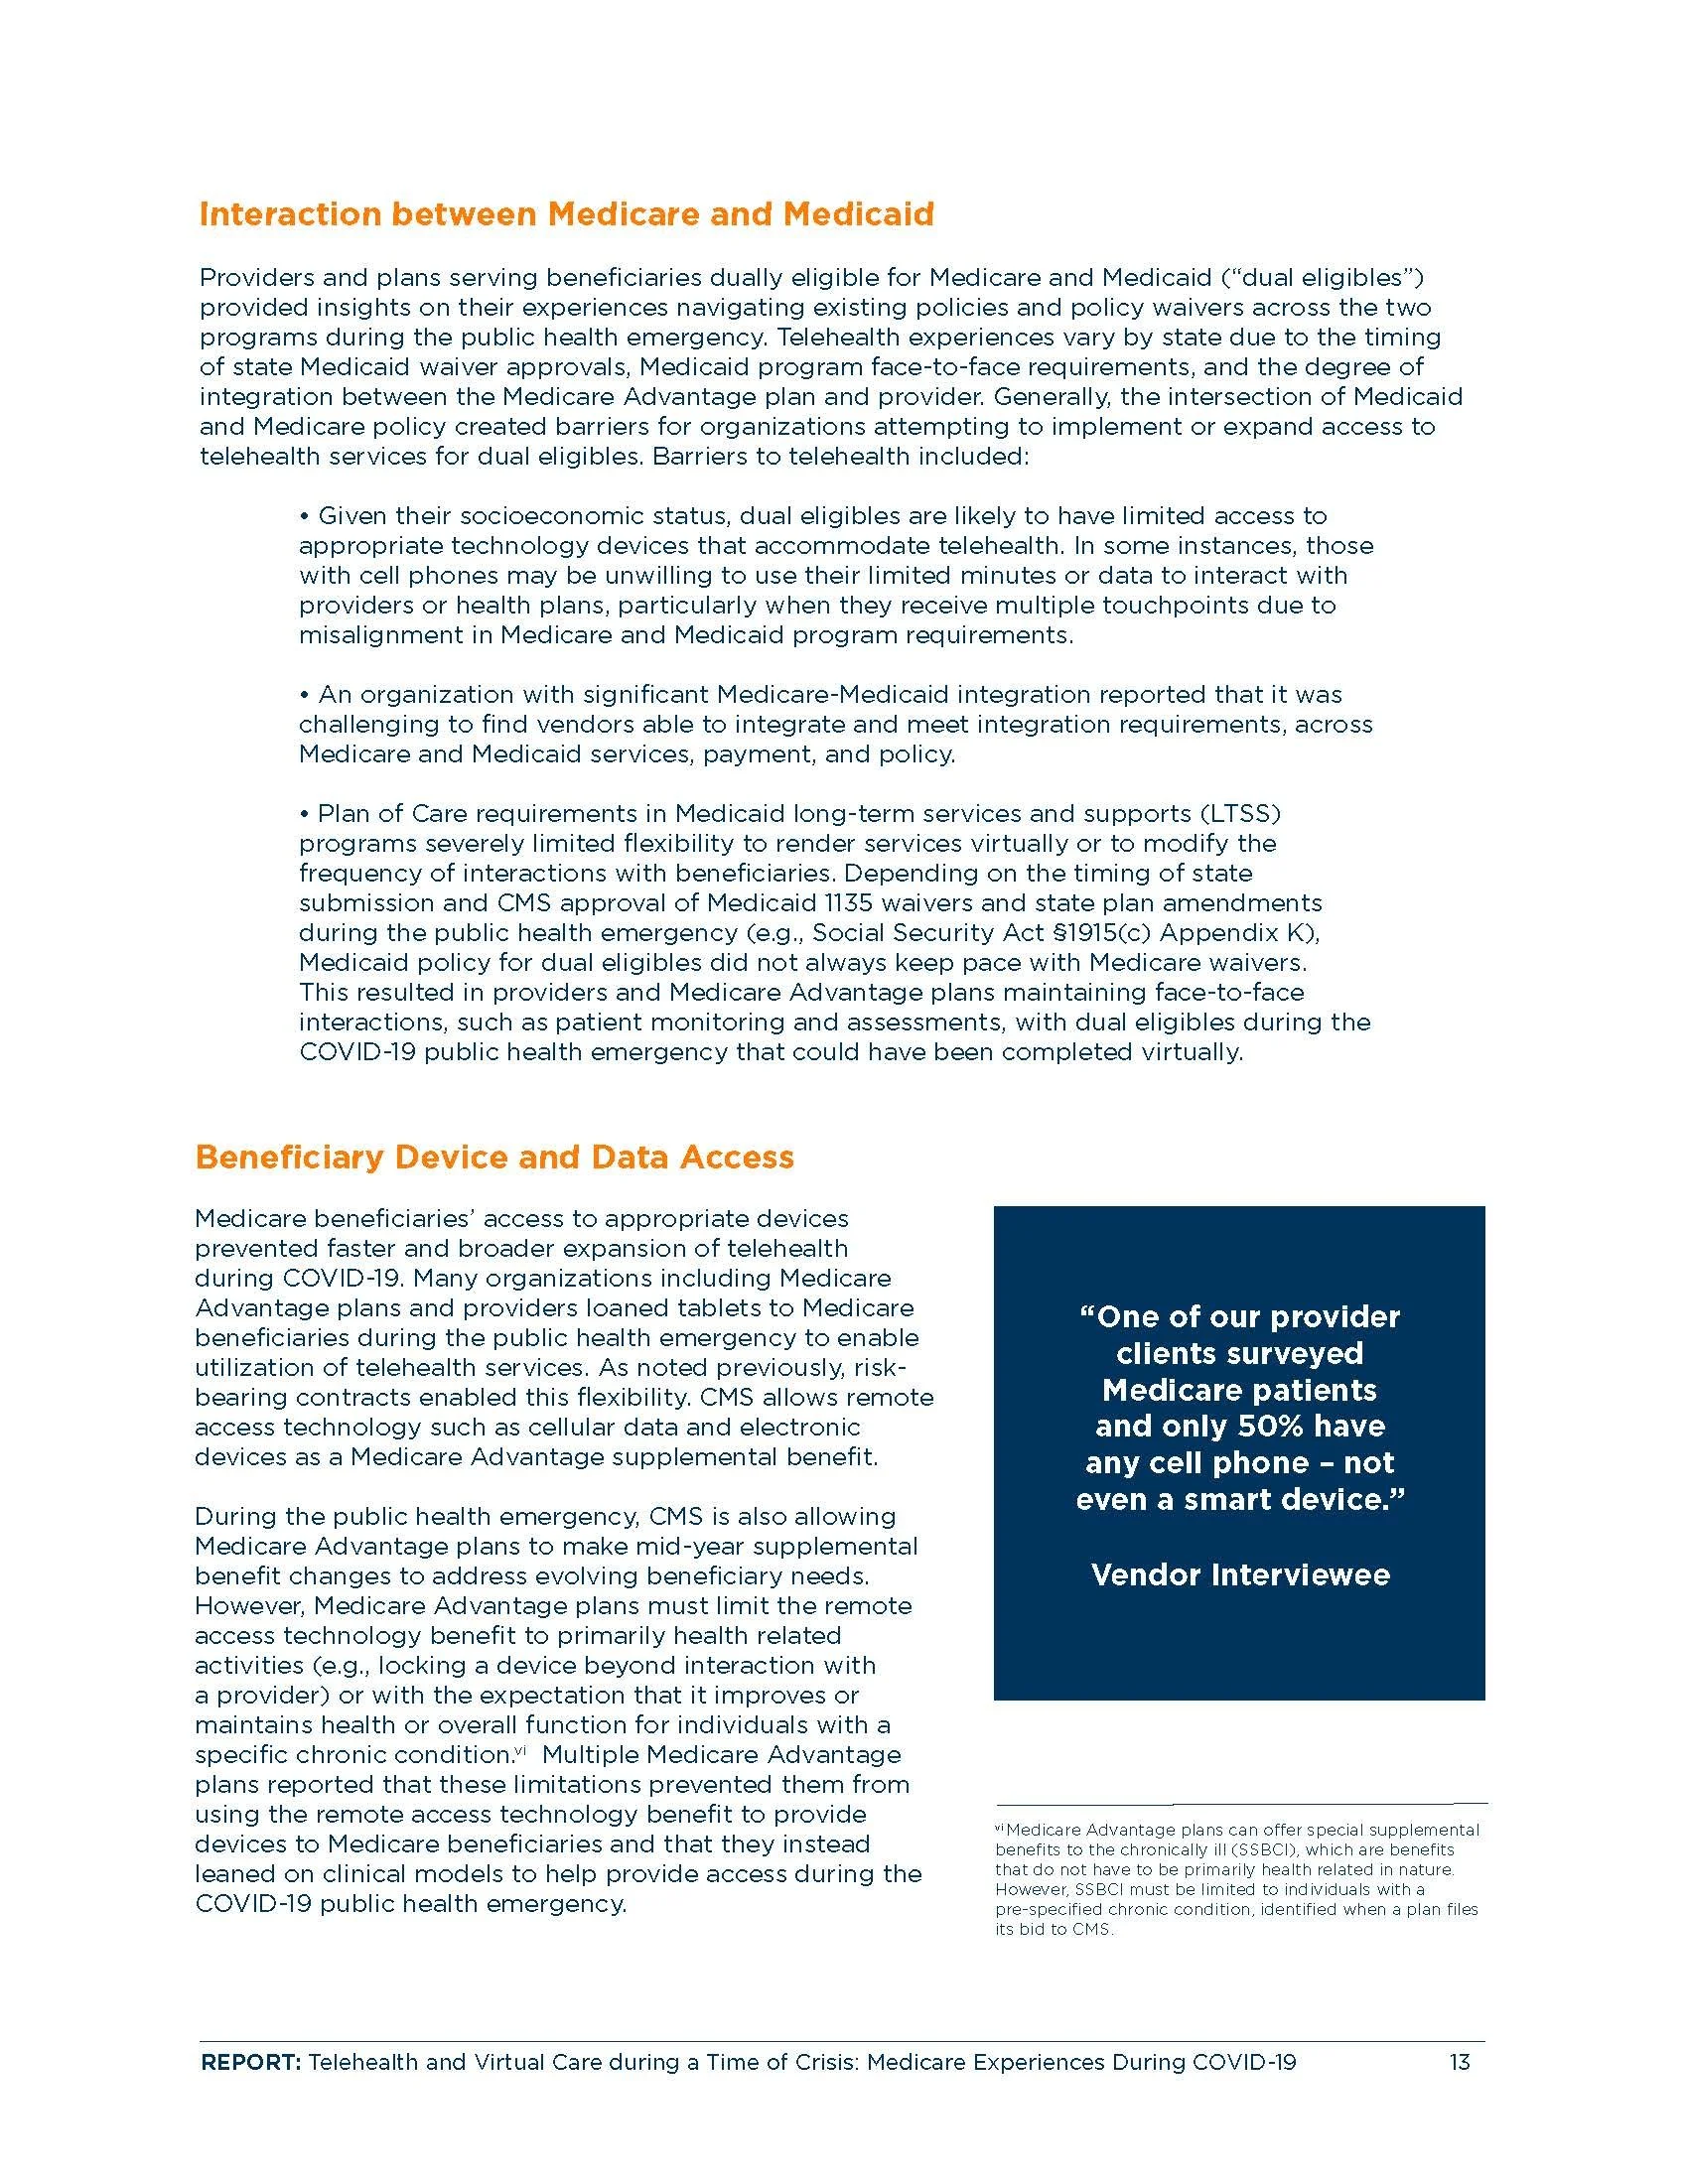
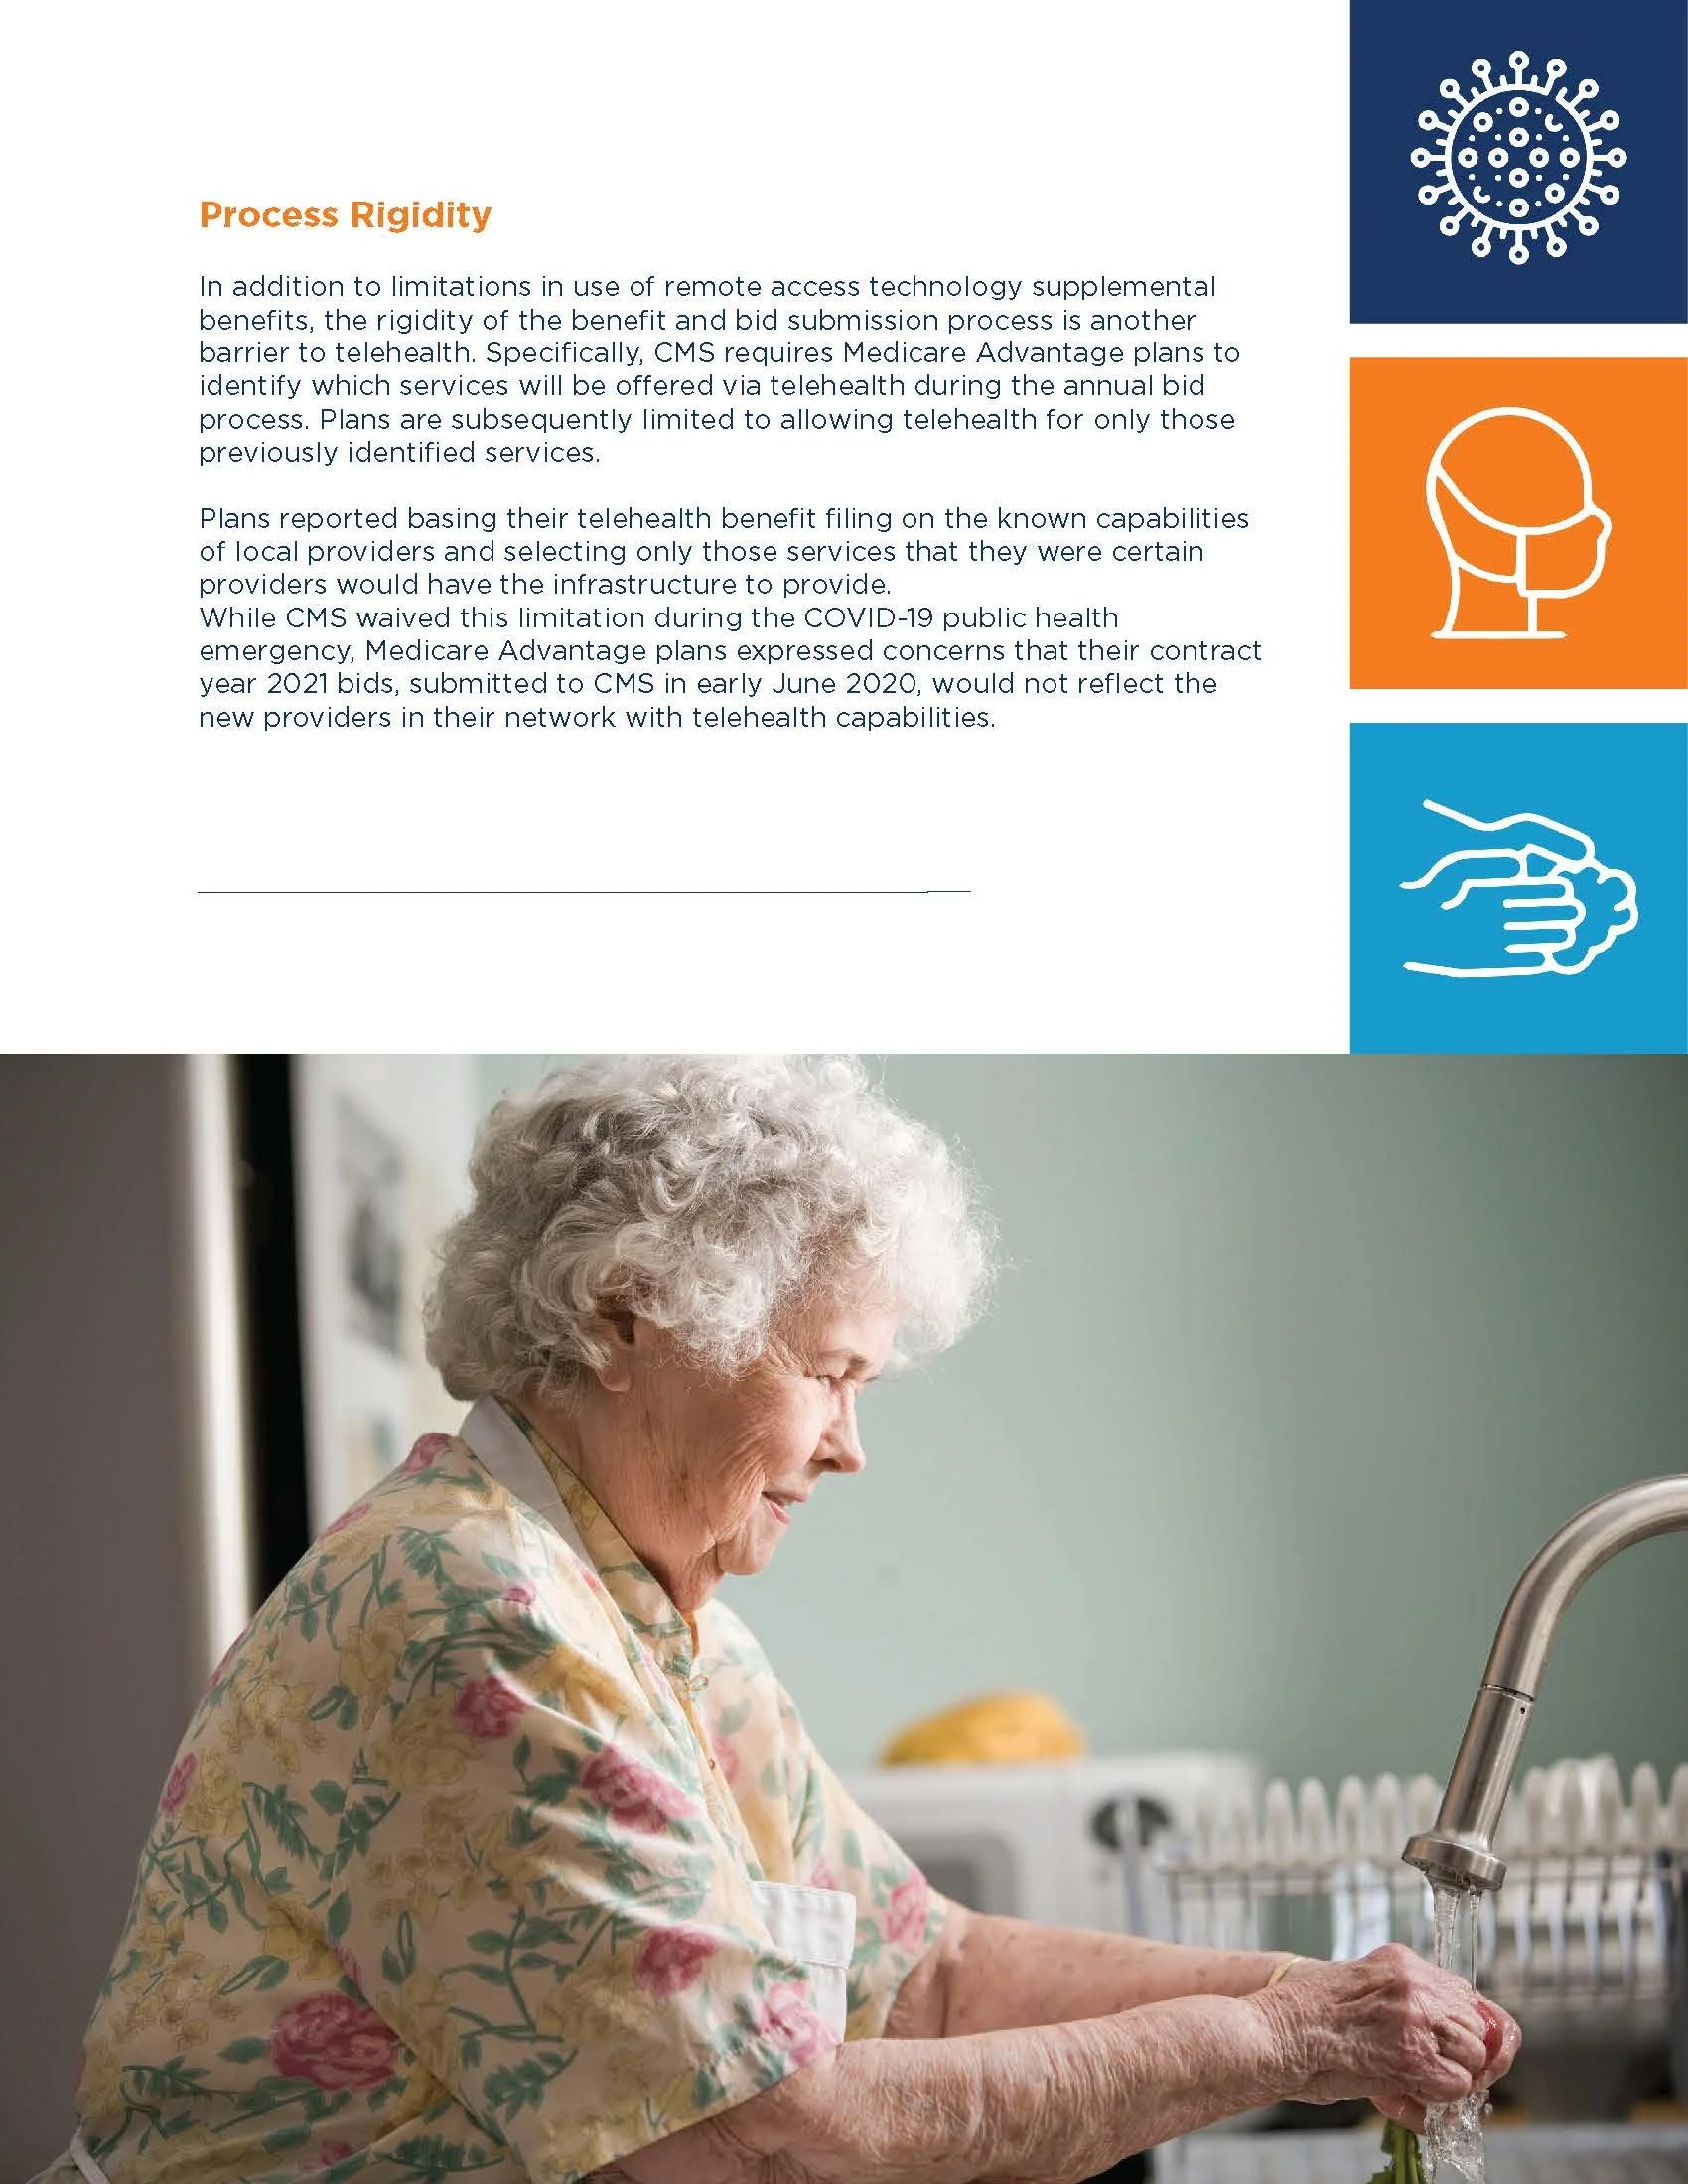
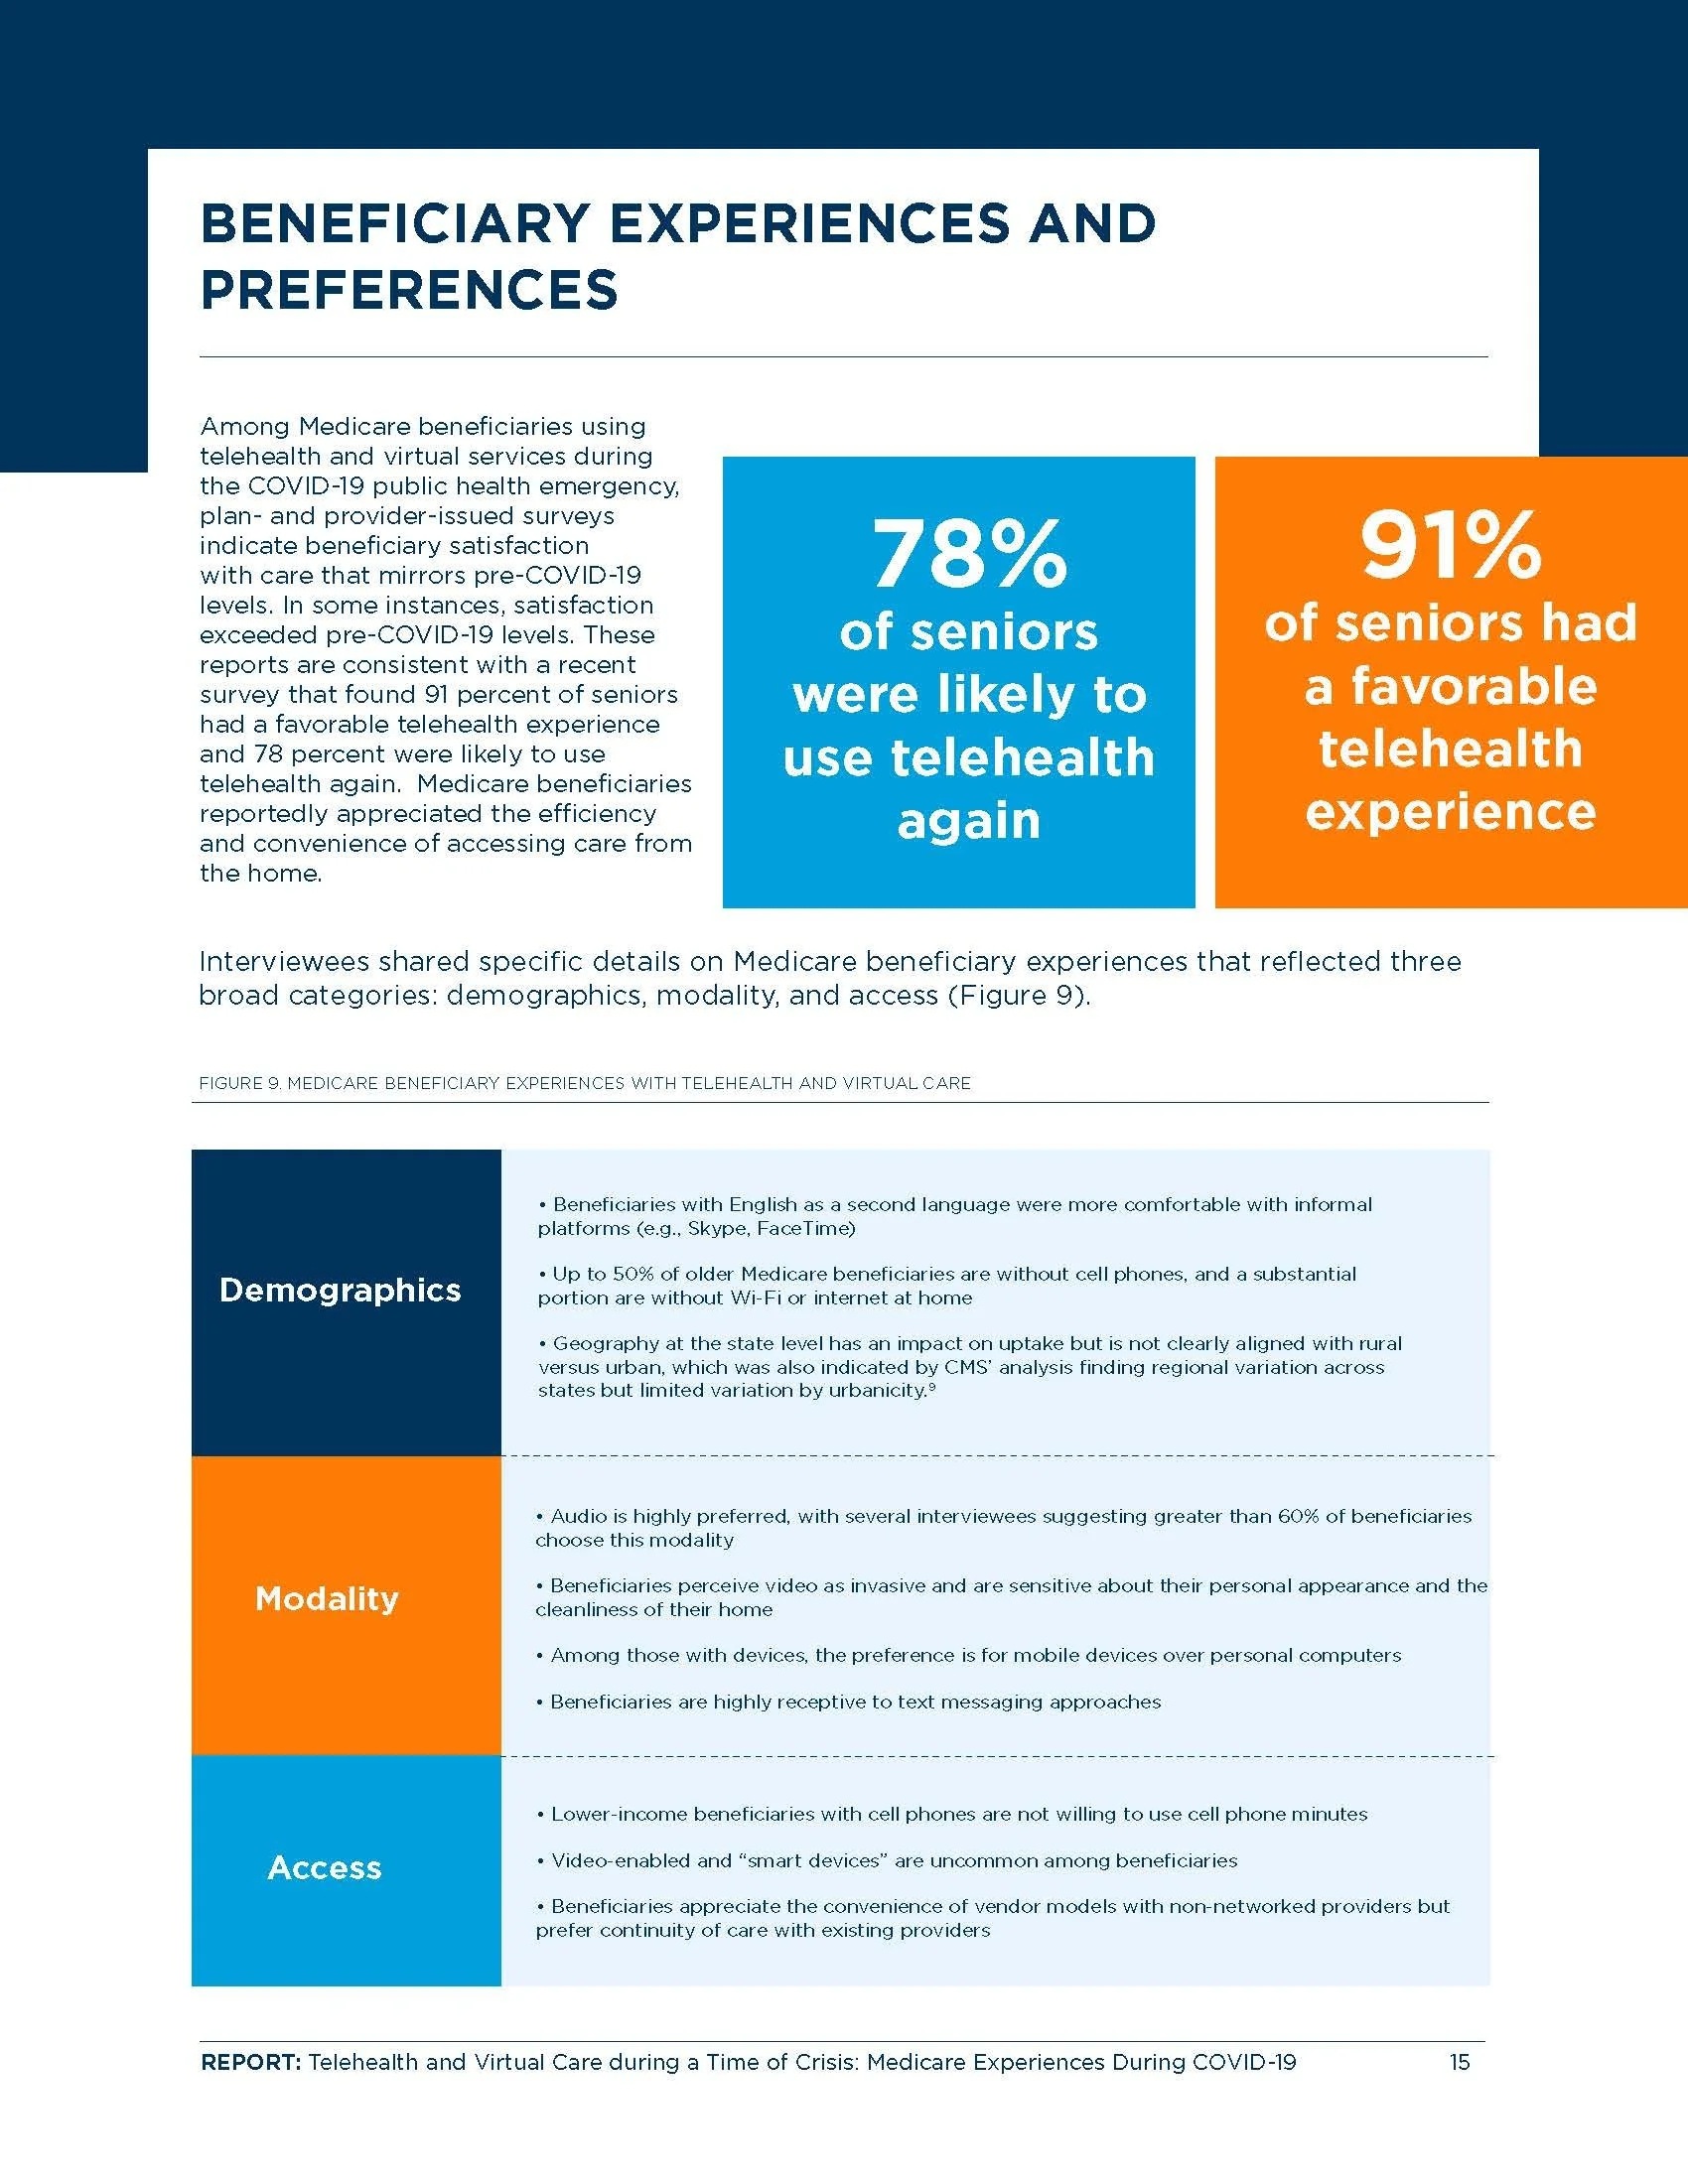
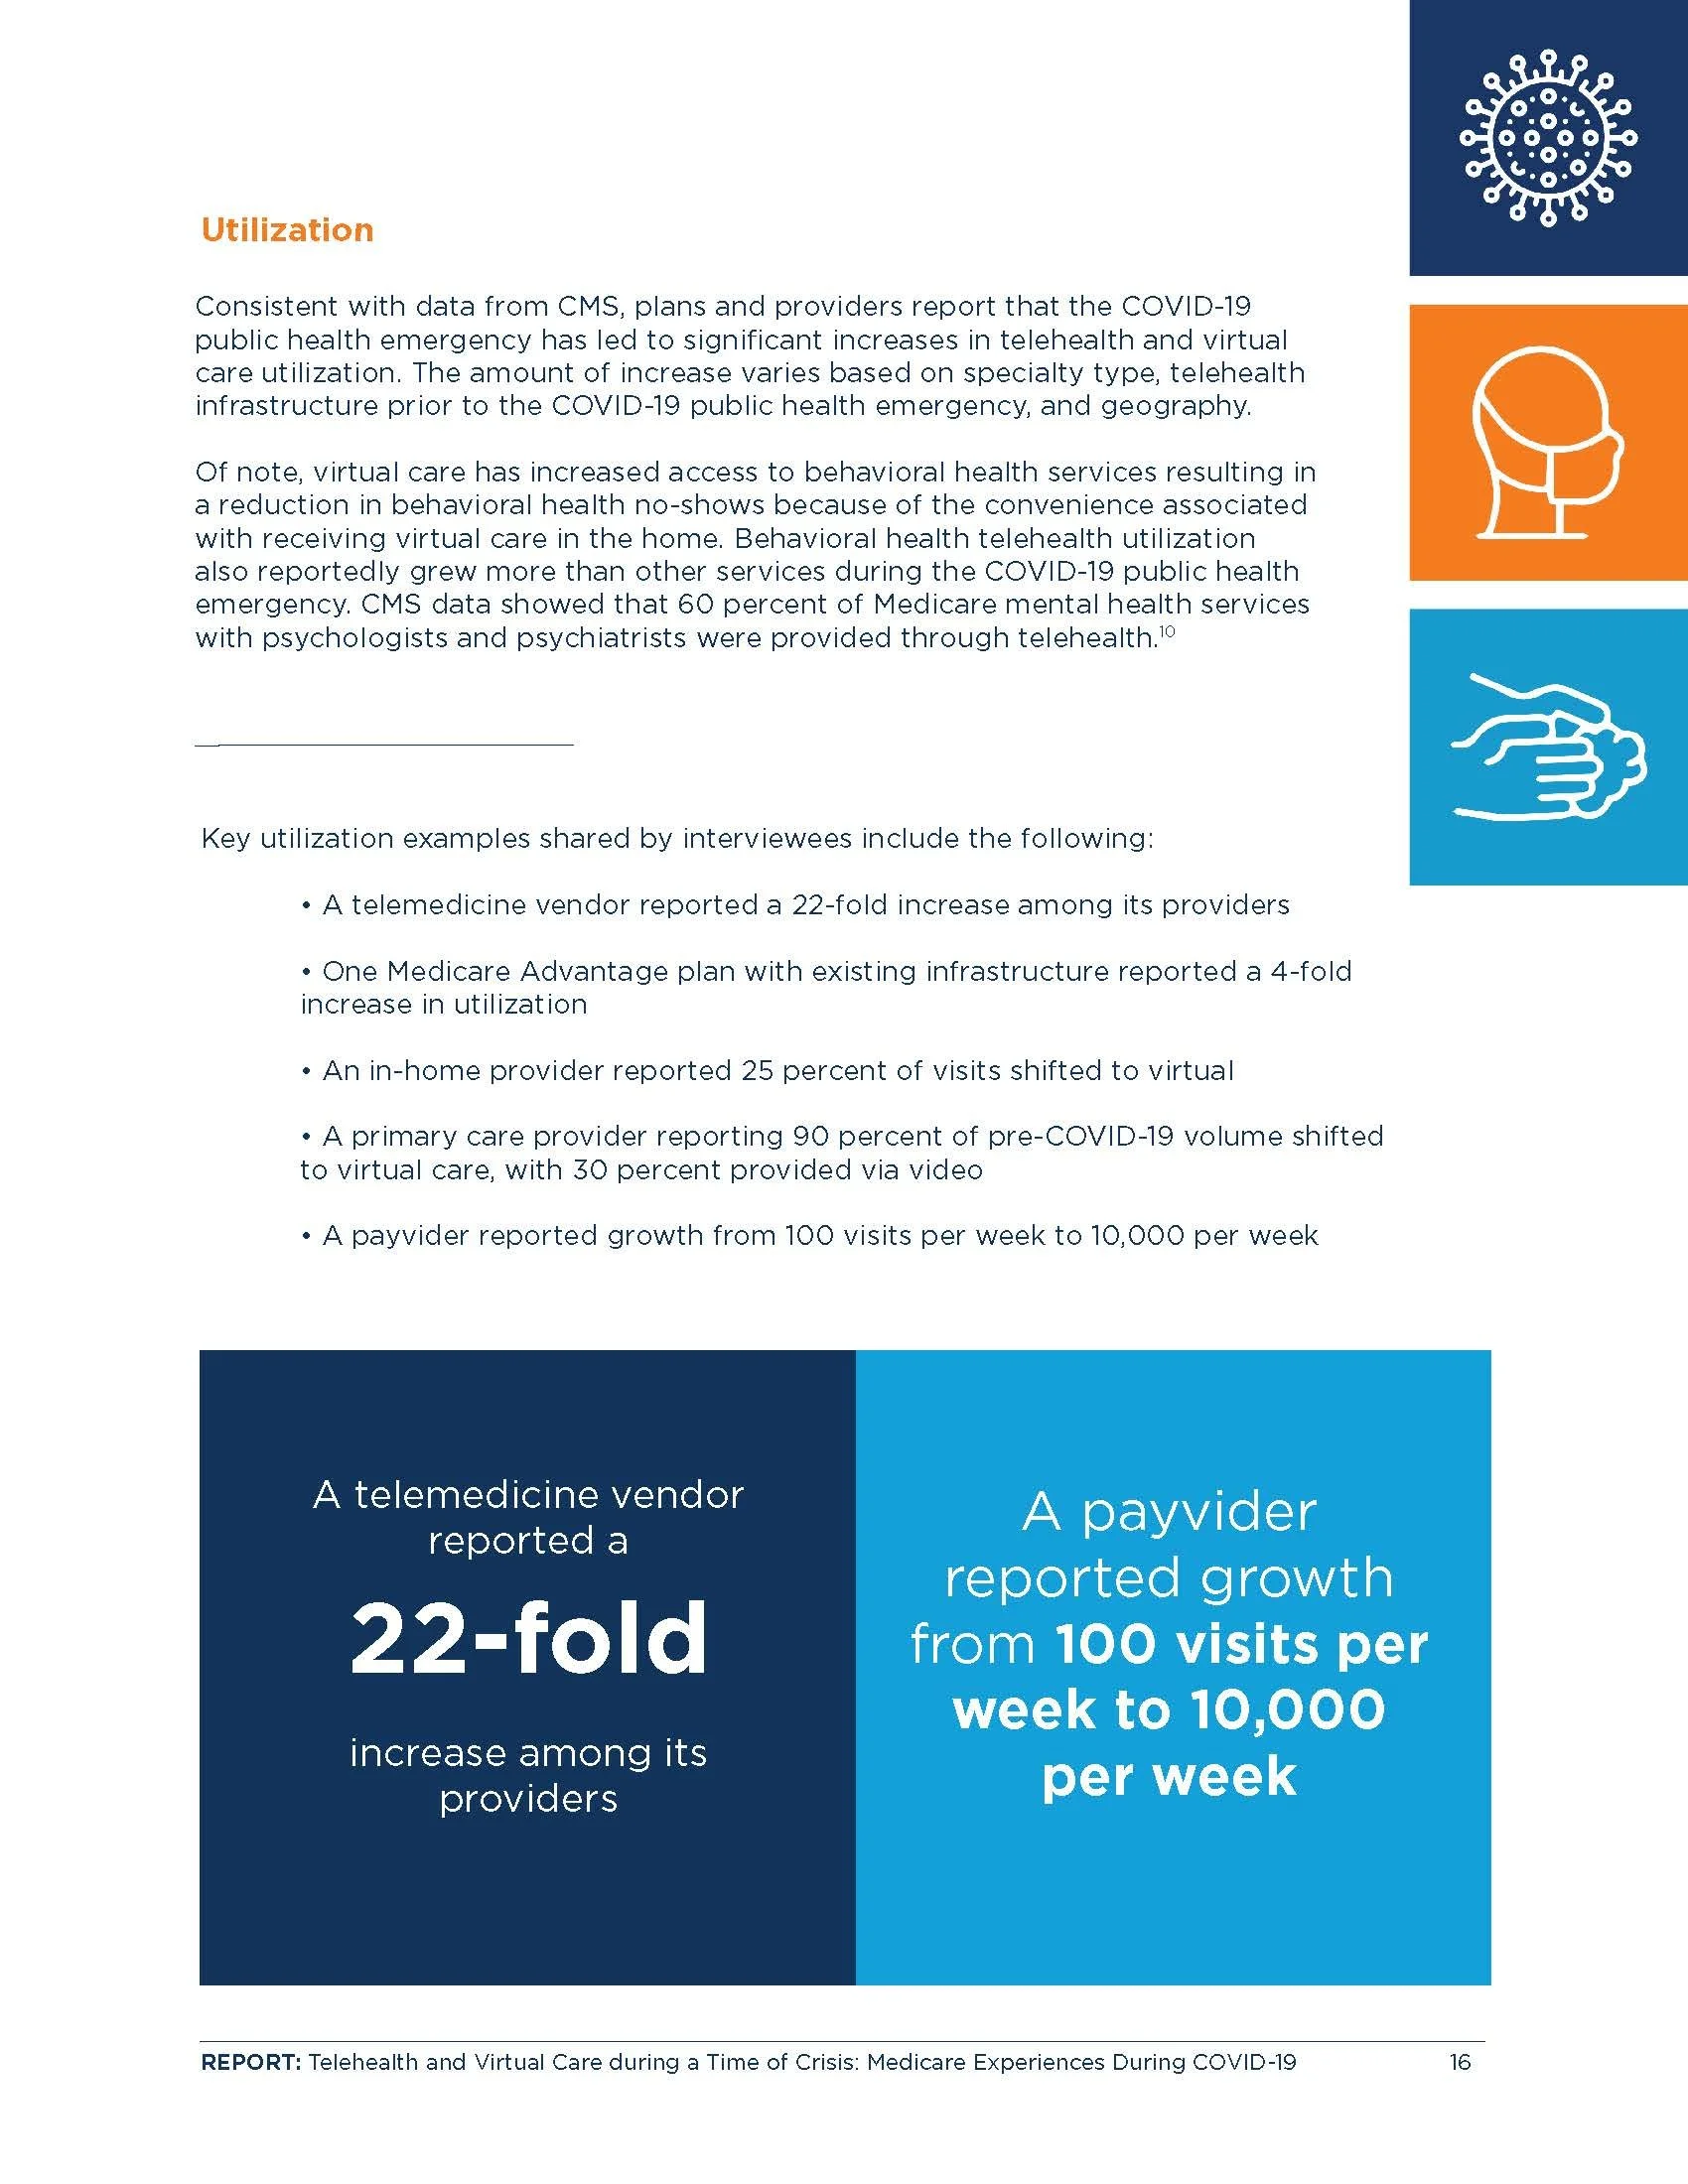
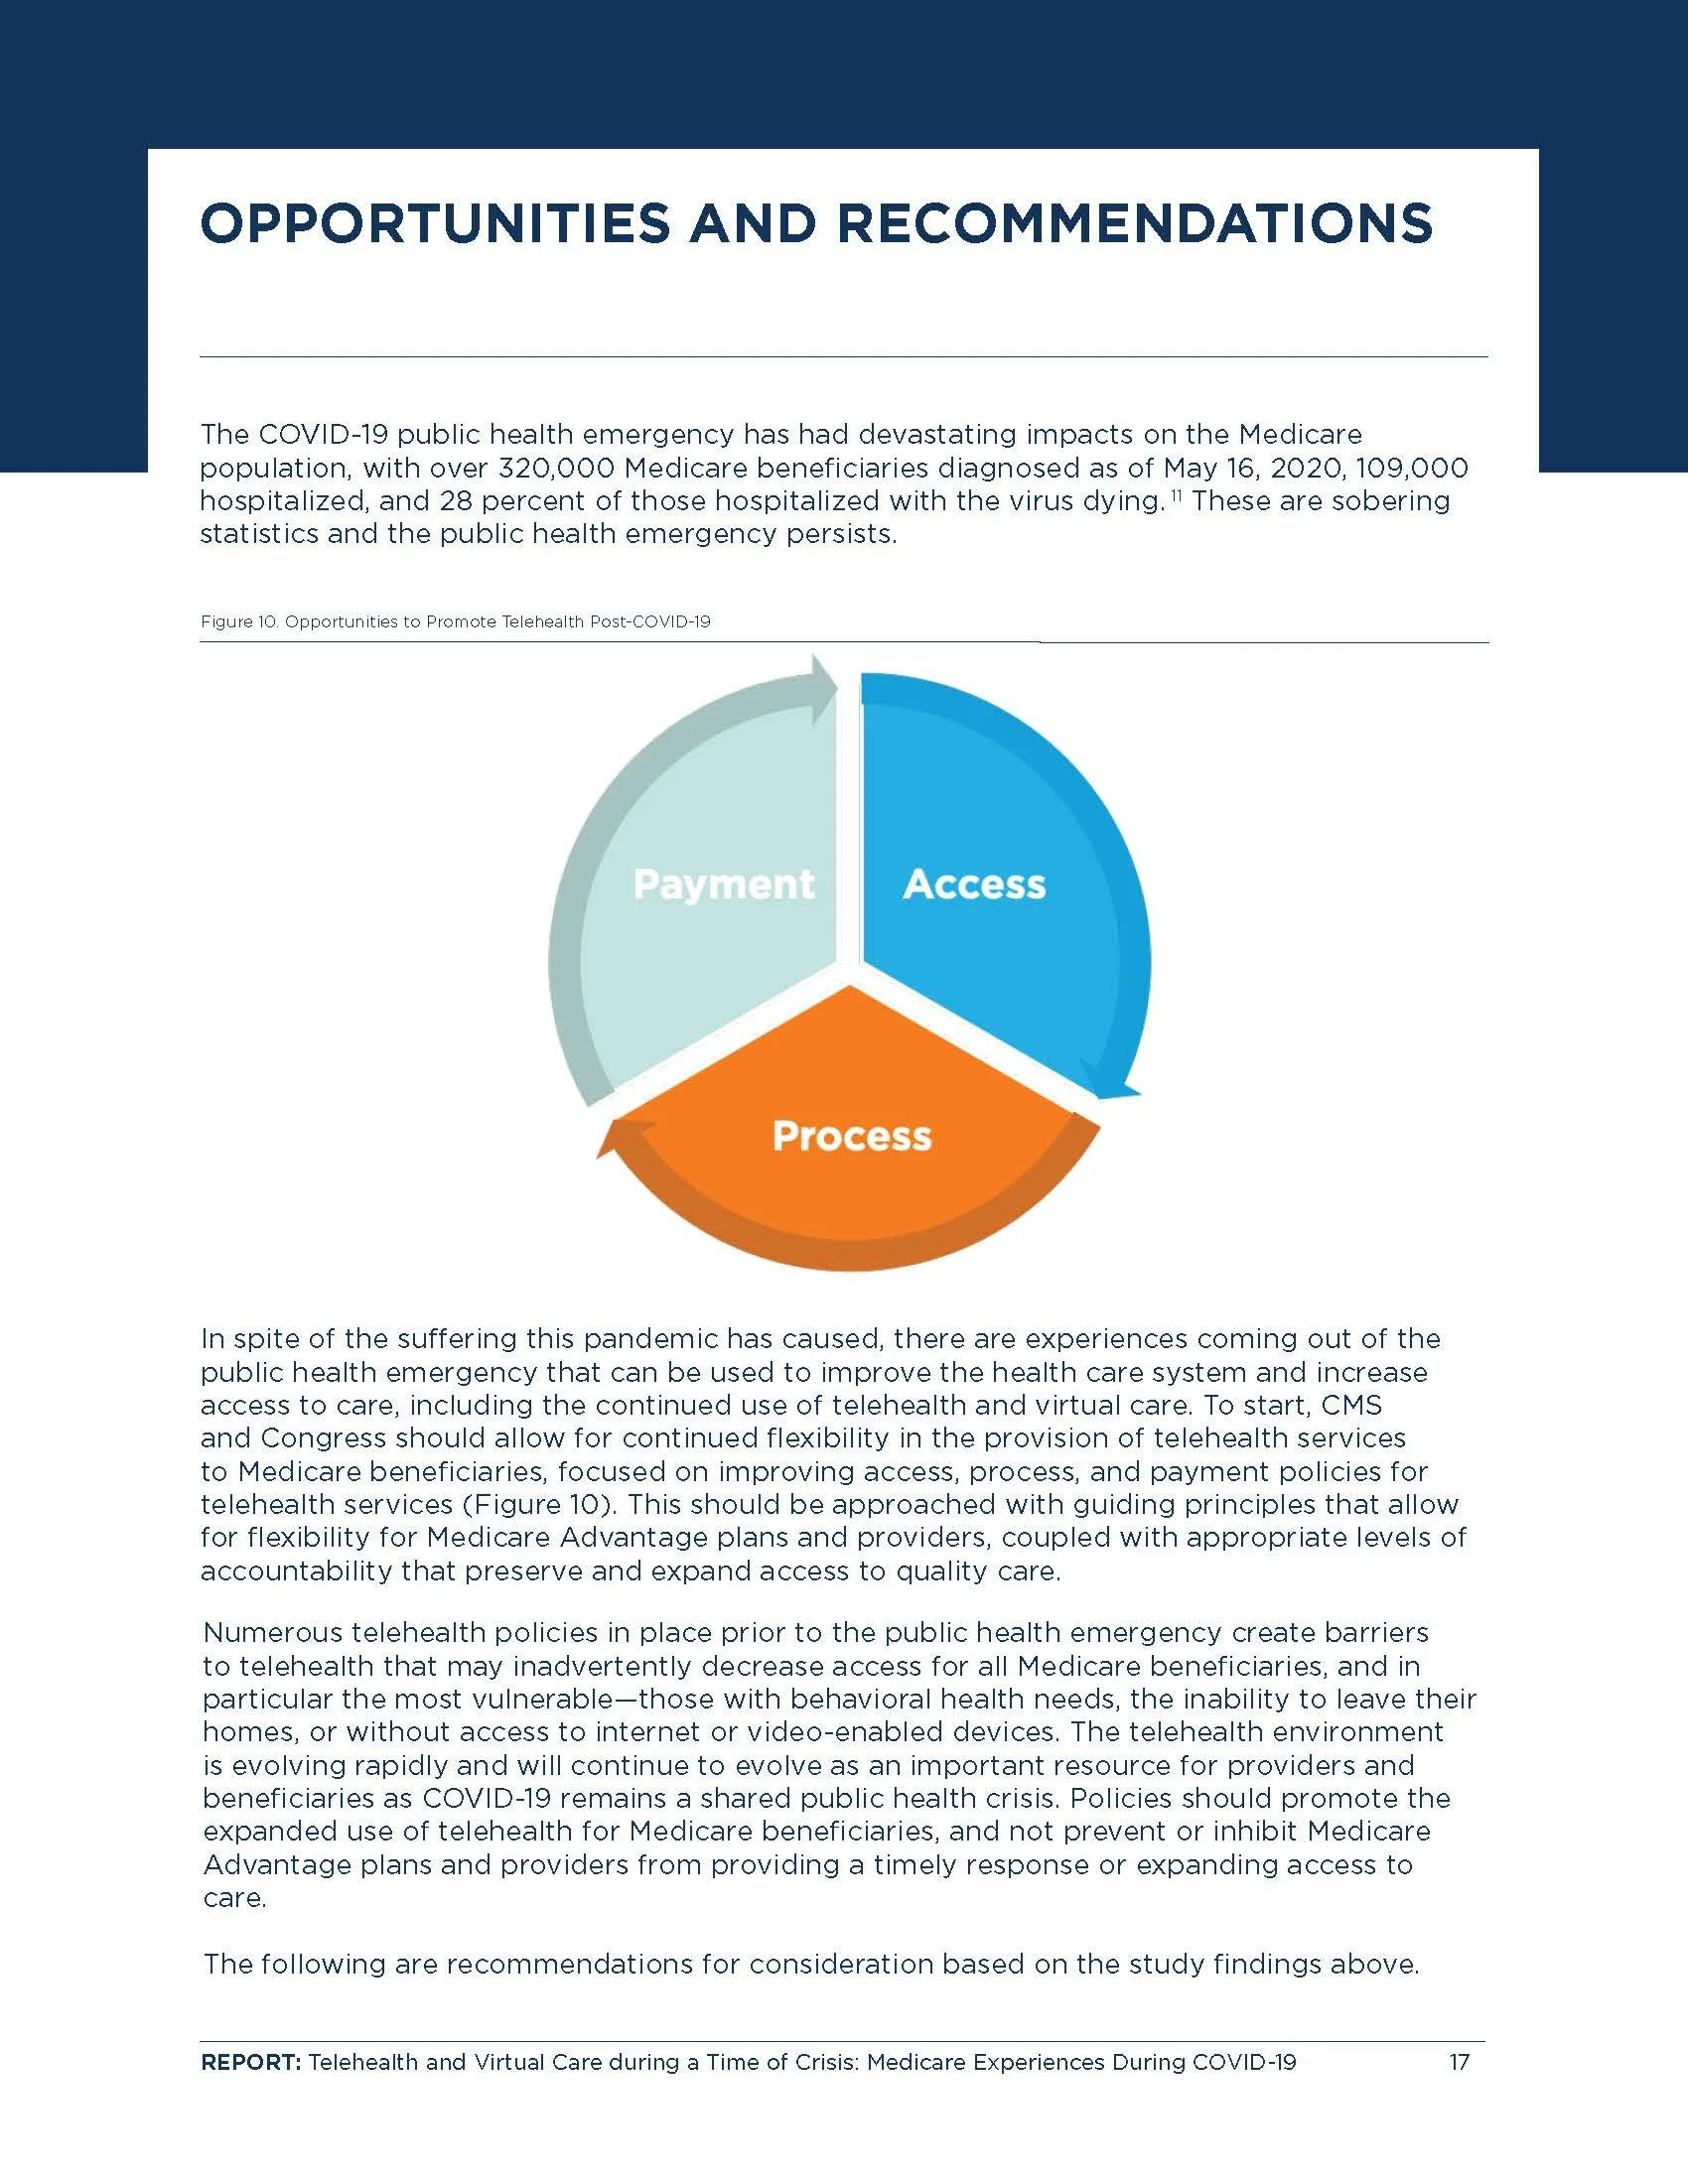
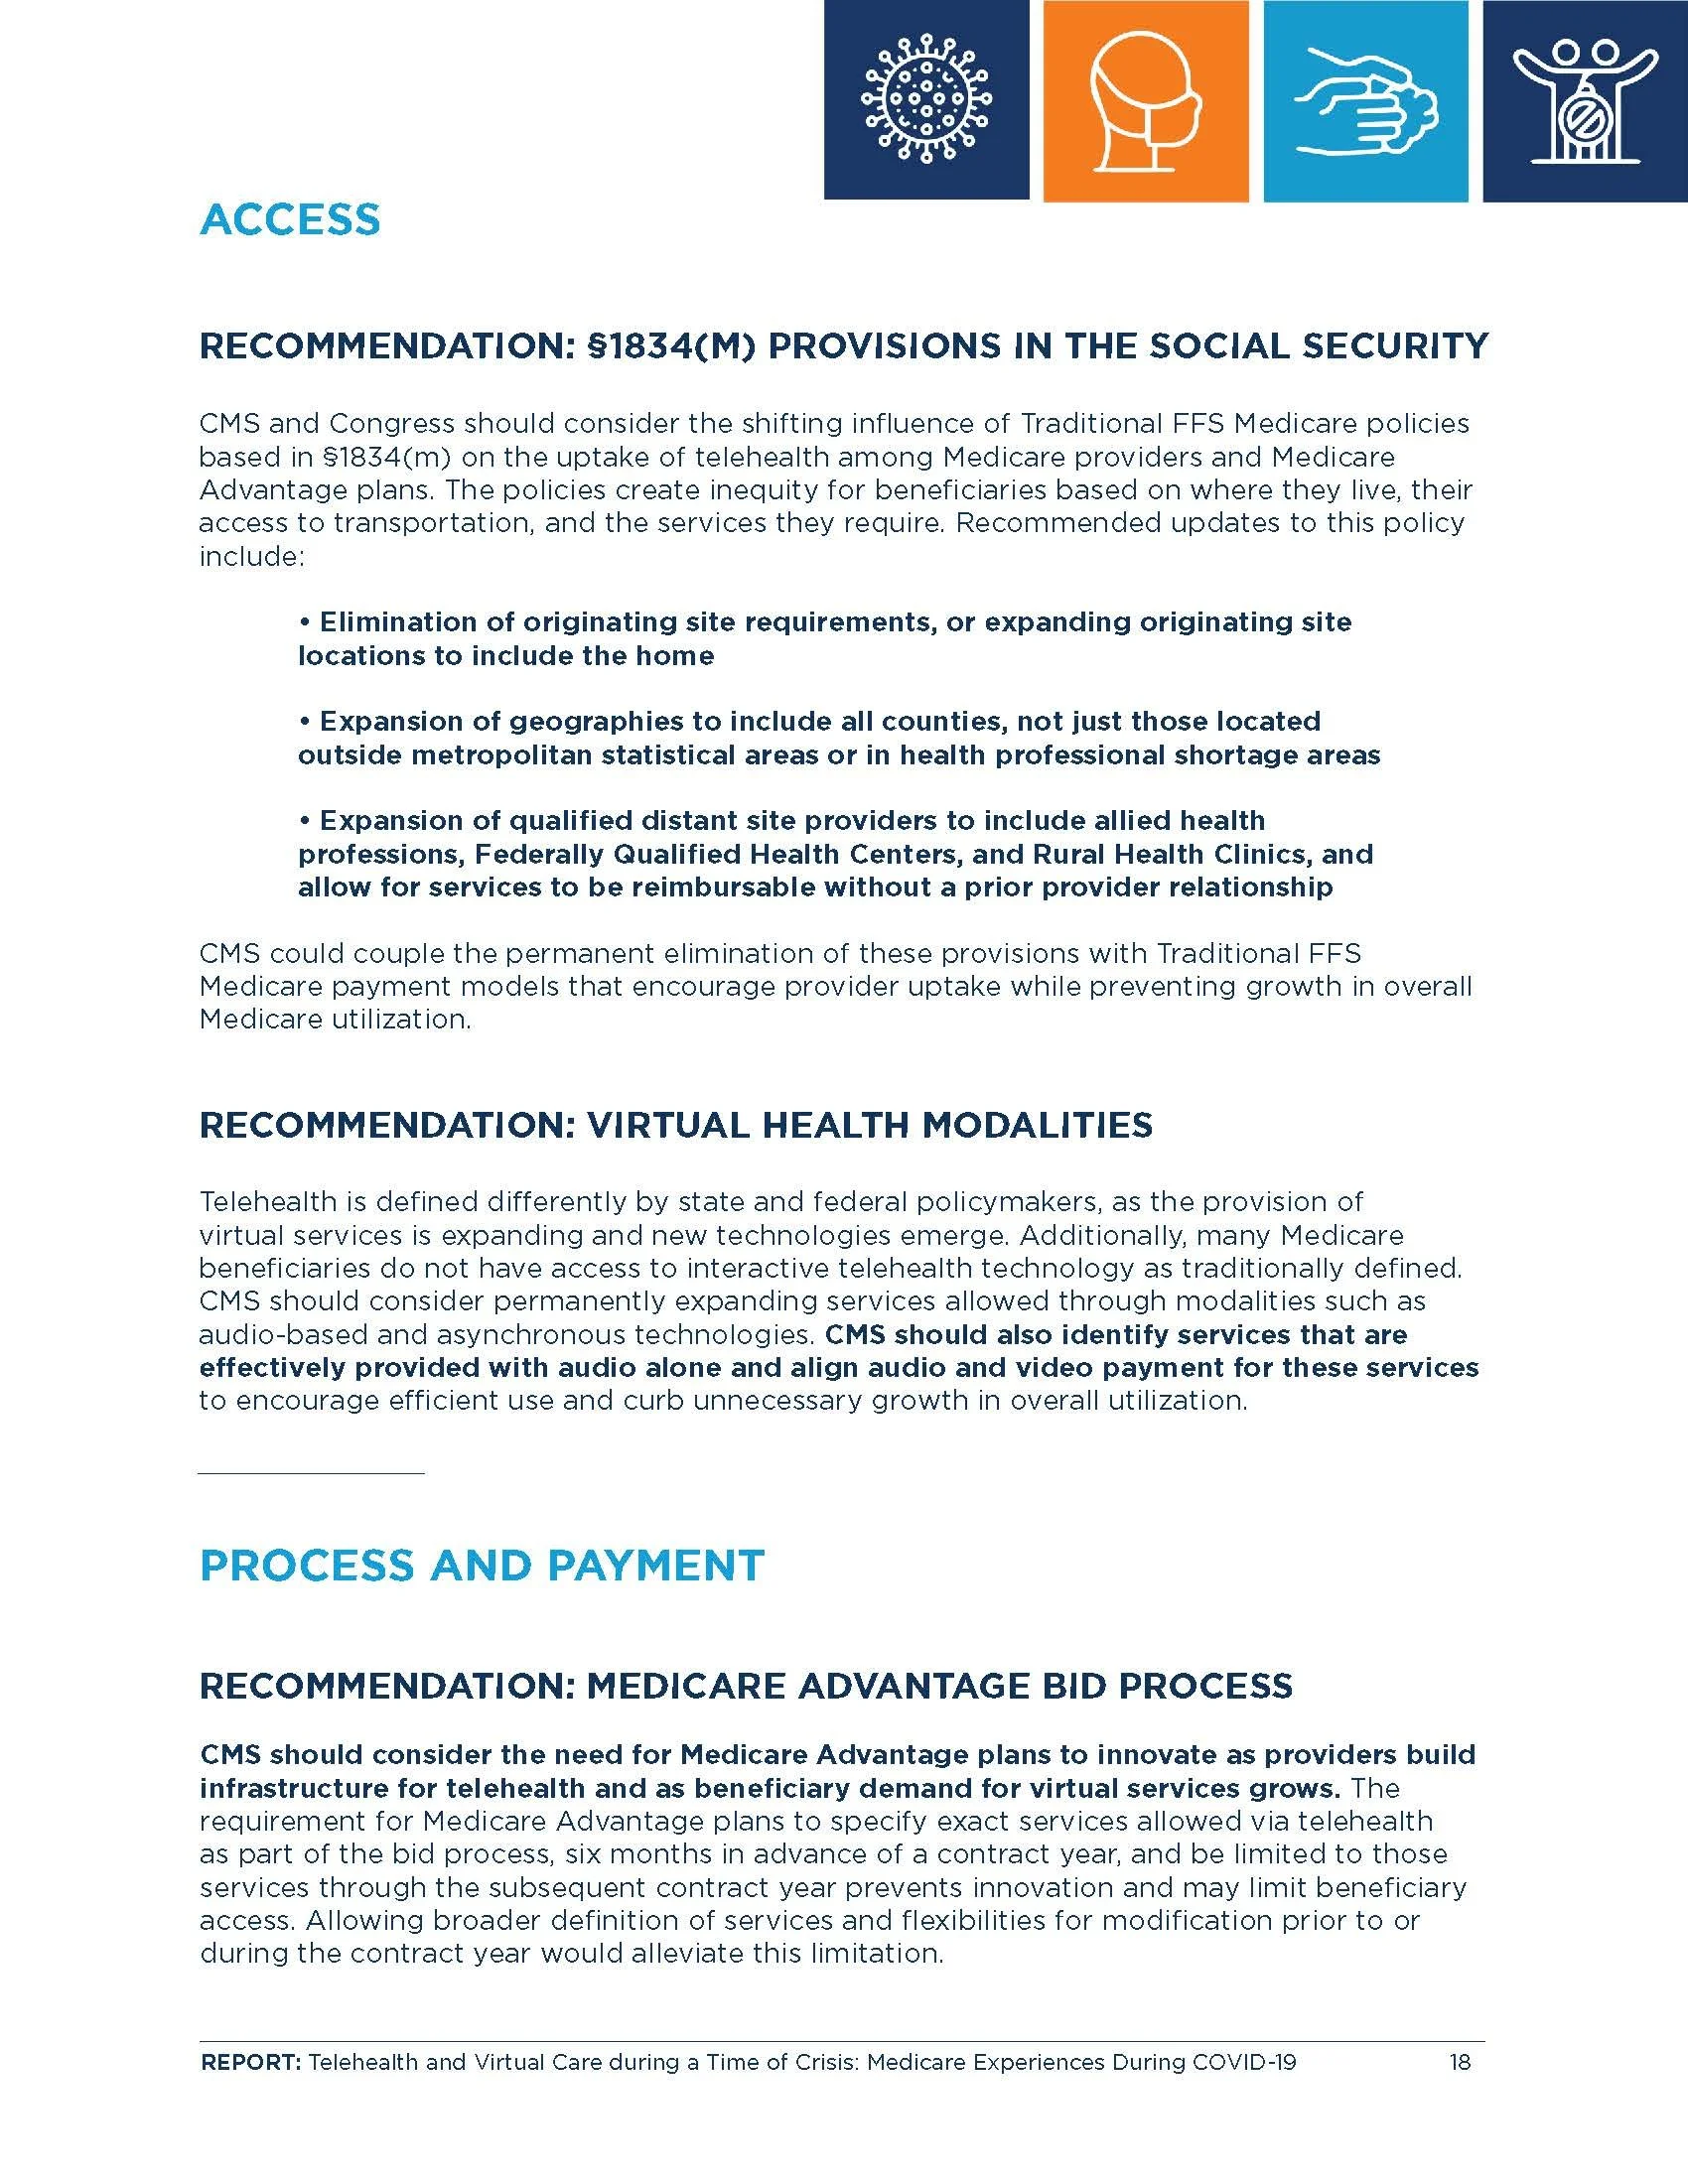
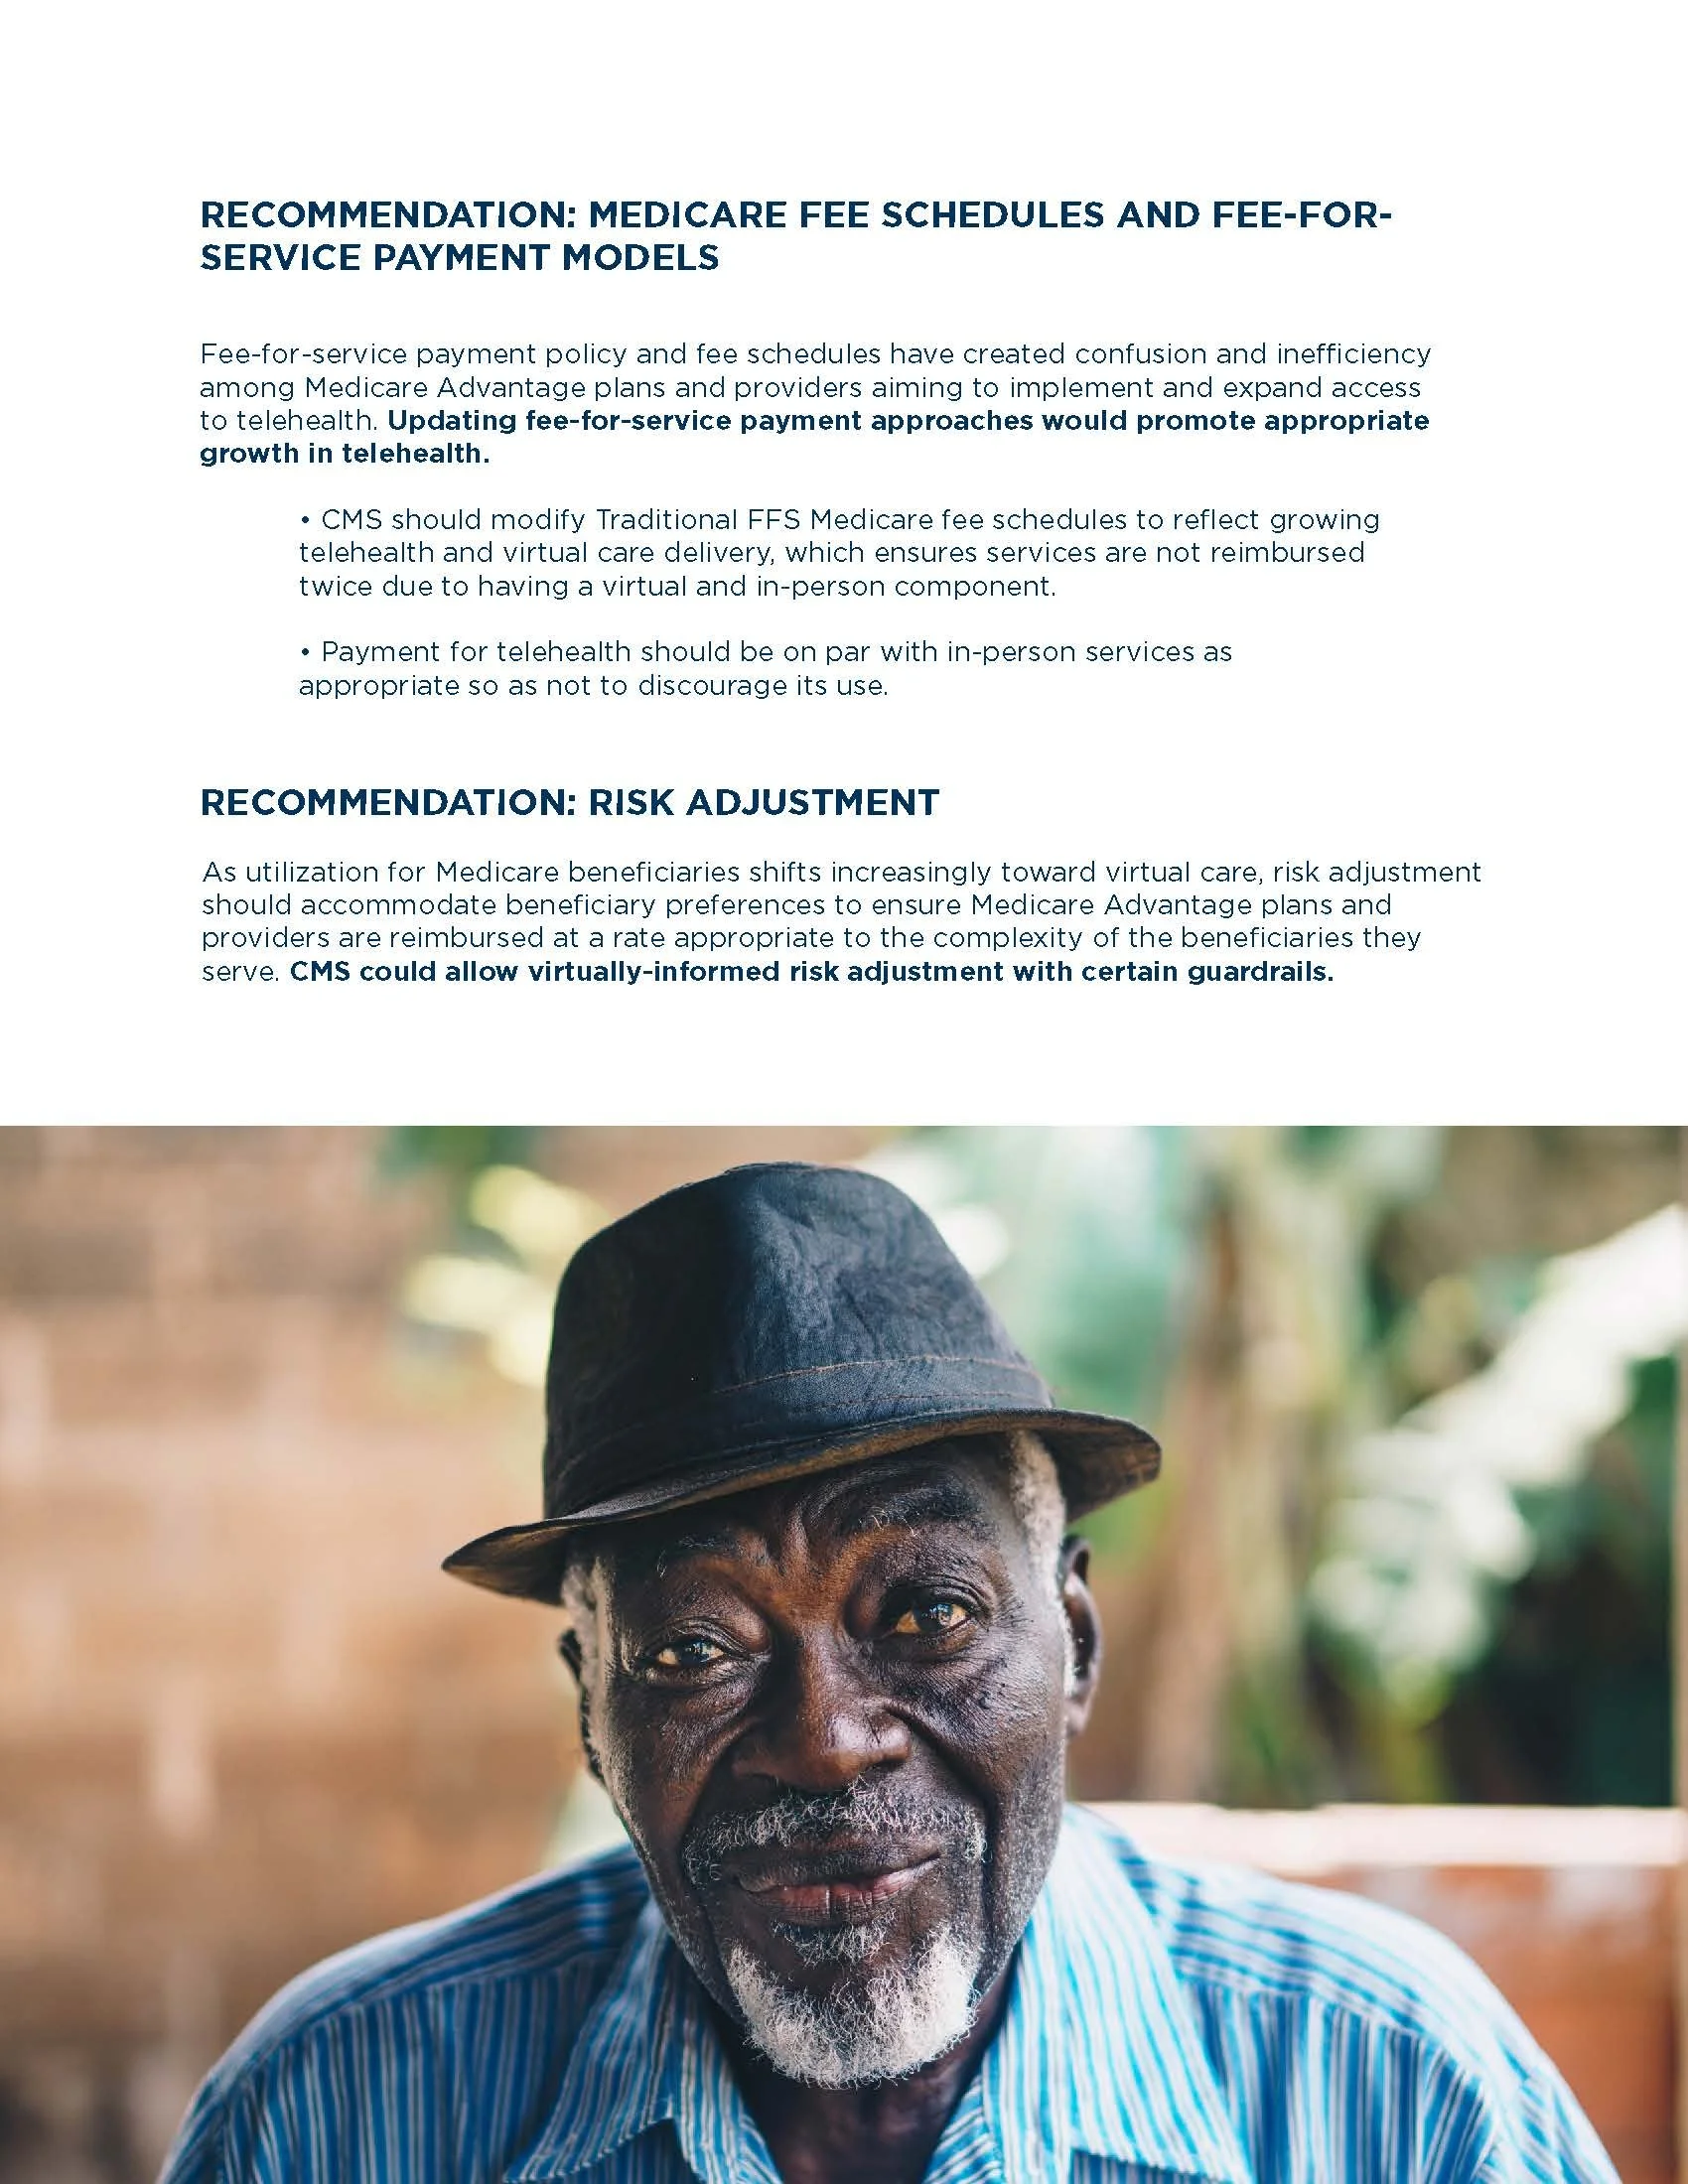
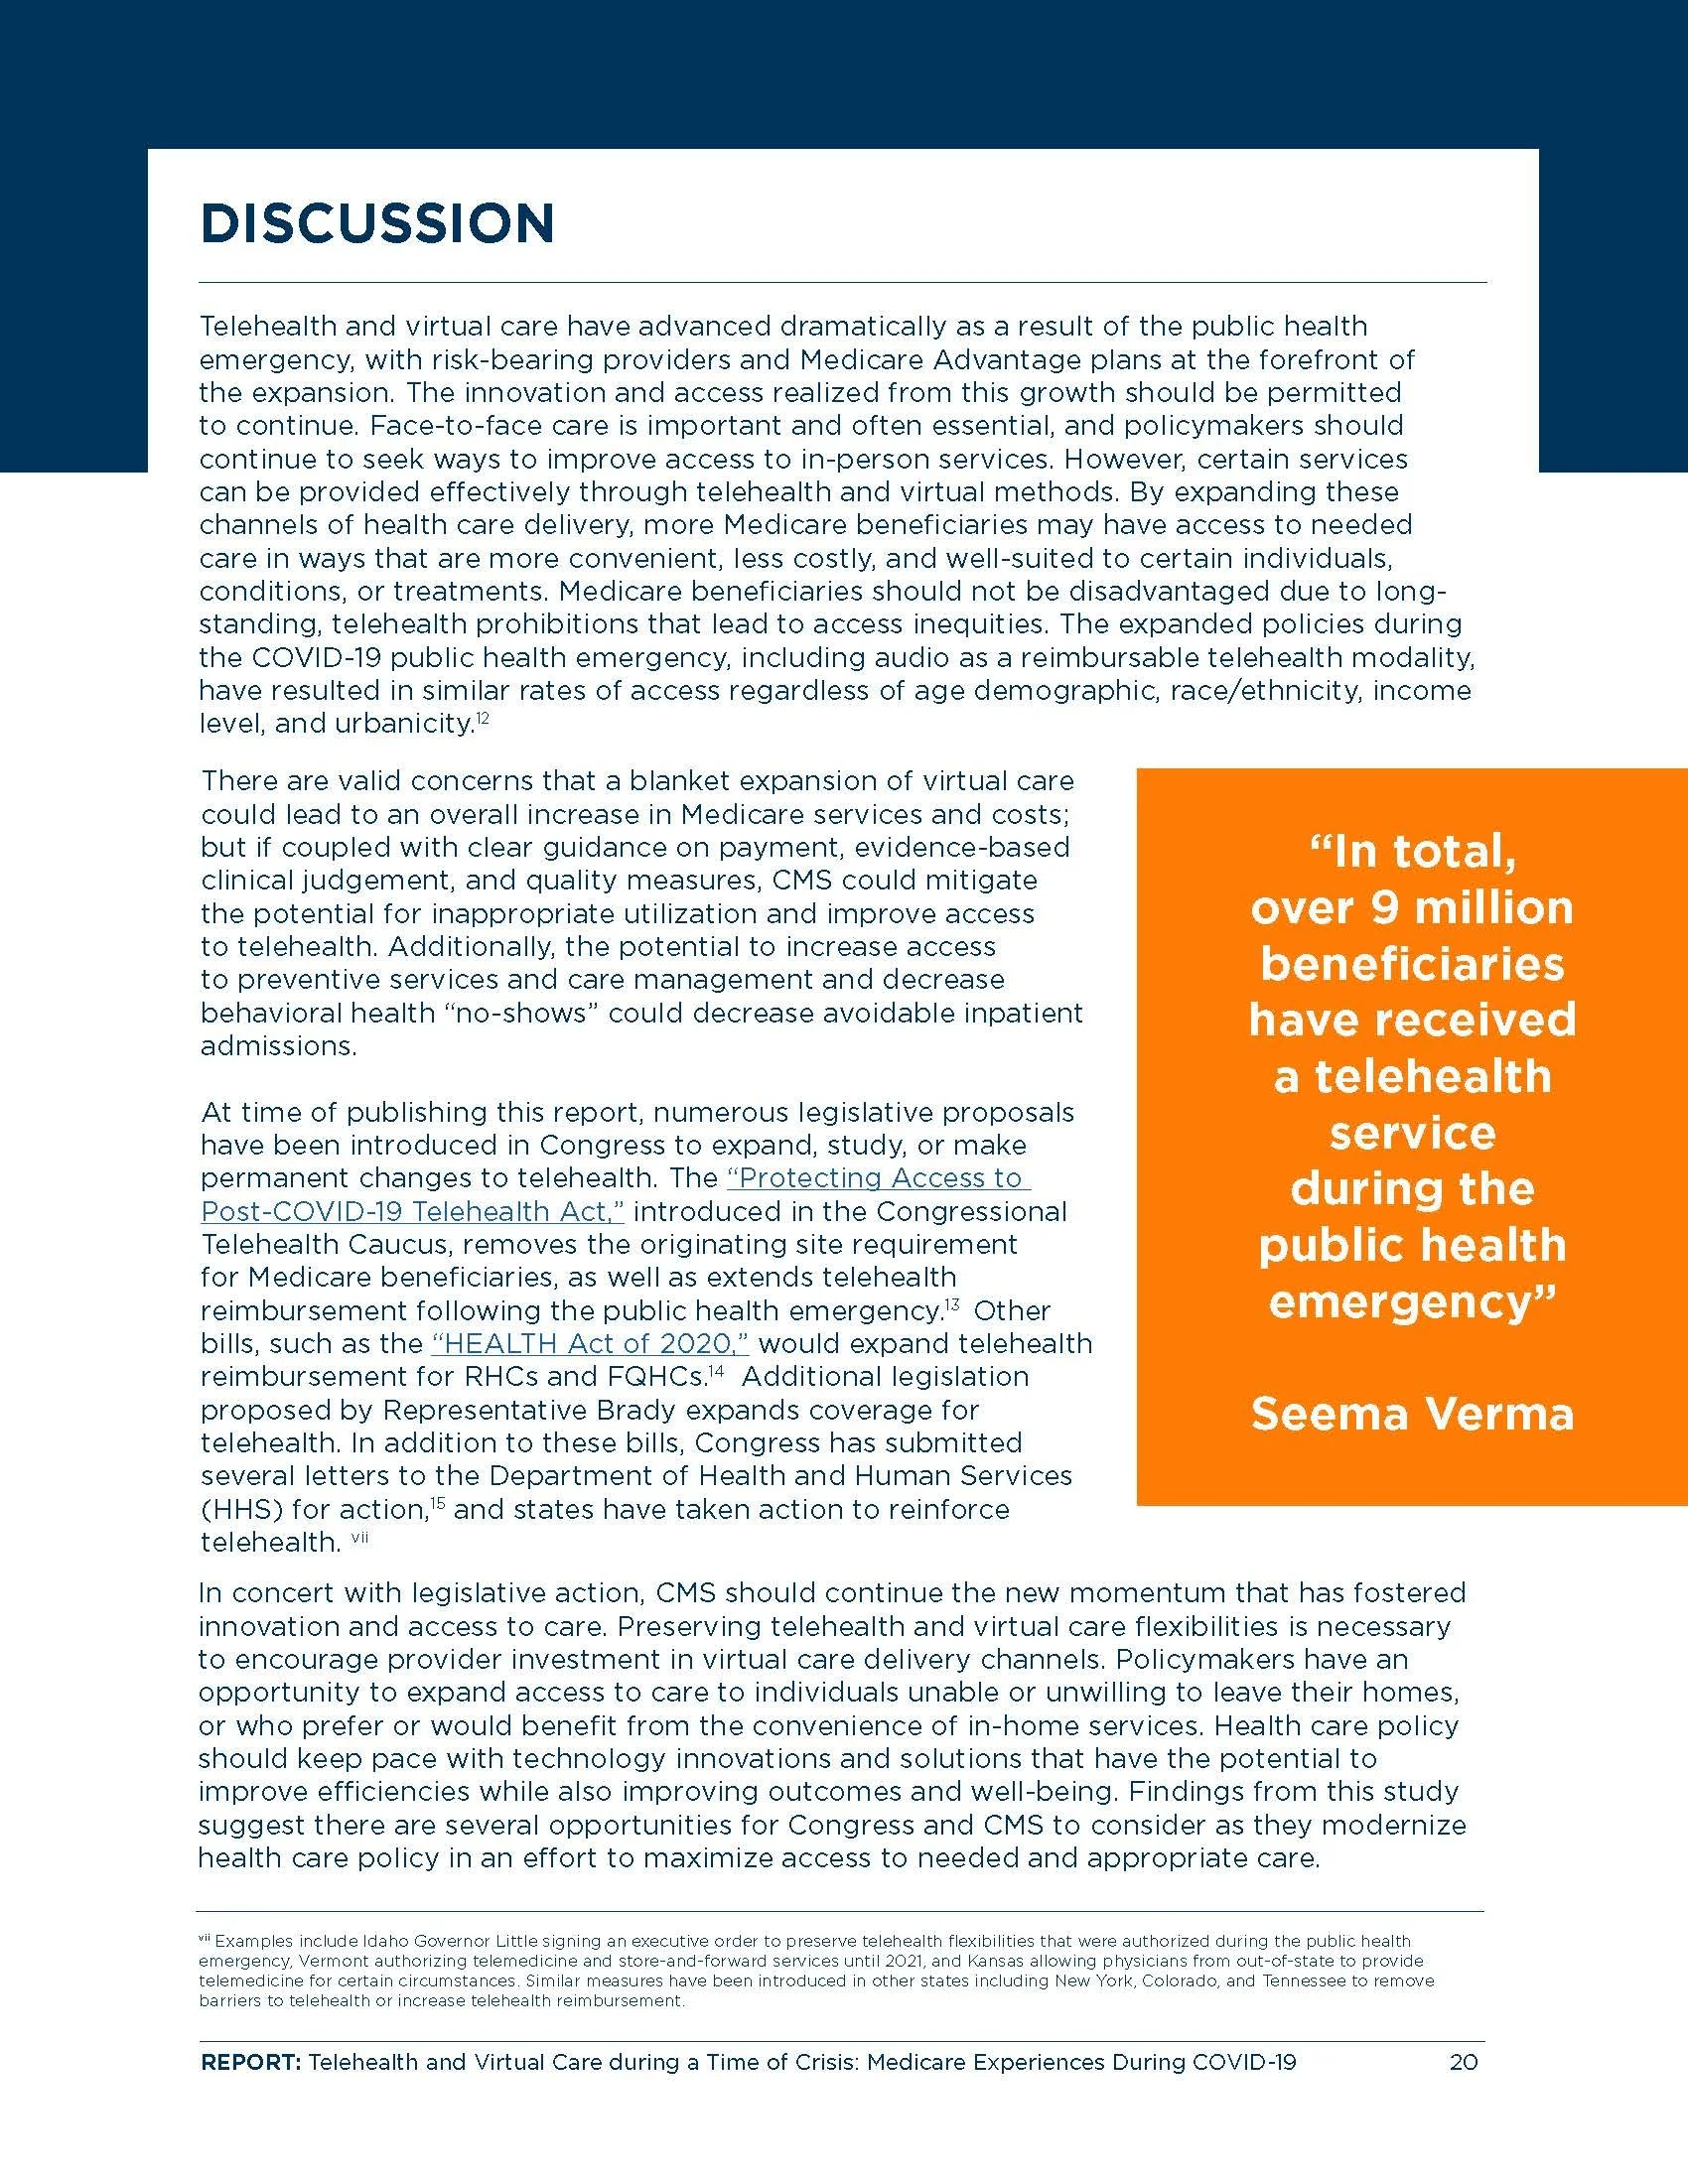
Working within Better Medicare Alliance's established brand guidelines, I designed the entire 21-page report, including its layouts, charts, infographics, and diagrams. I used visual hierarchy, color, typography, and custom graphics to break up dense information, highlight important findings, and translate complicated concepts into clear, digestible visuals.
The Challenge
The report contained extensive research, statistics, and complex healthcare policy information. The challenge was to transform this dense content into an engaging, easy-to-navigate publication that made key findings accessible without oversimplifying the information.
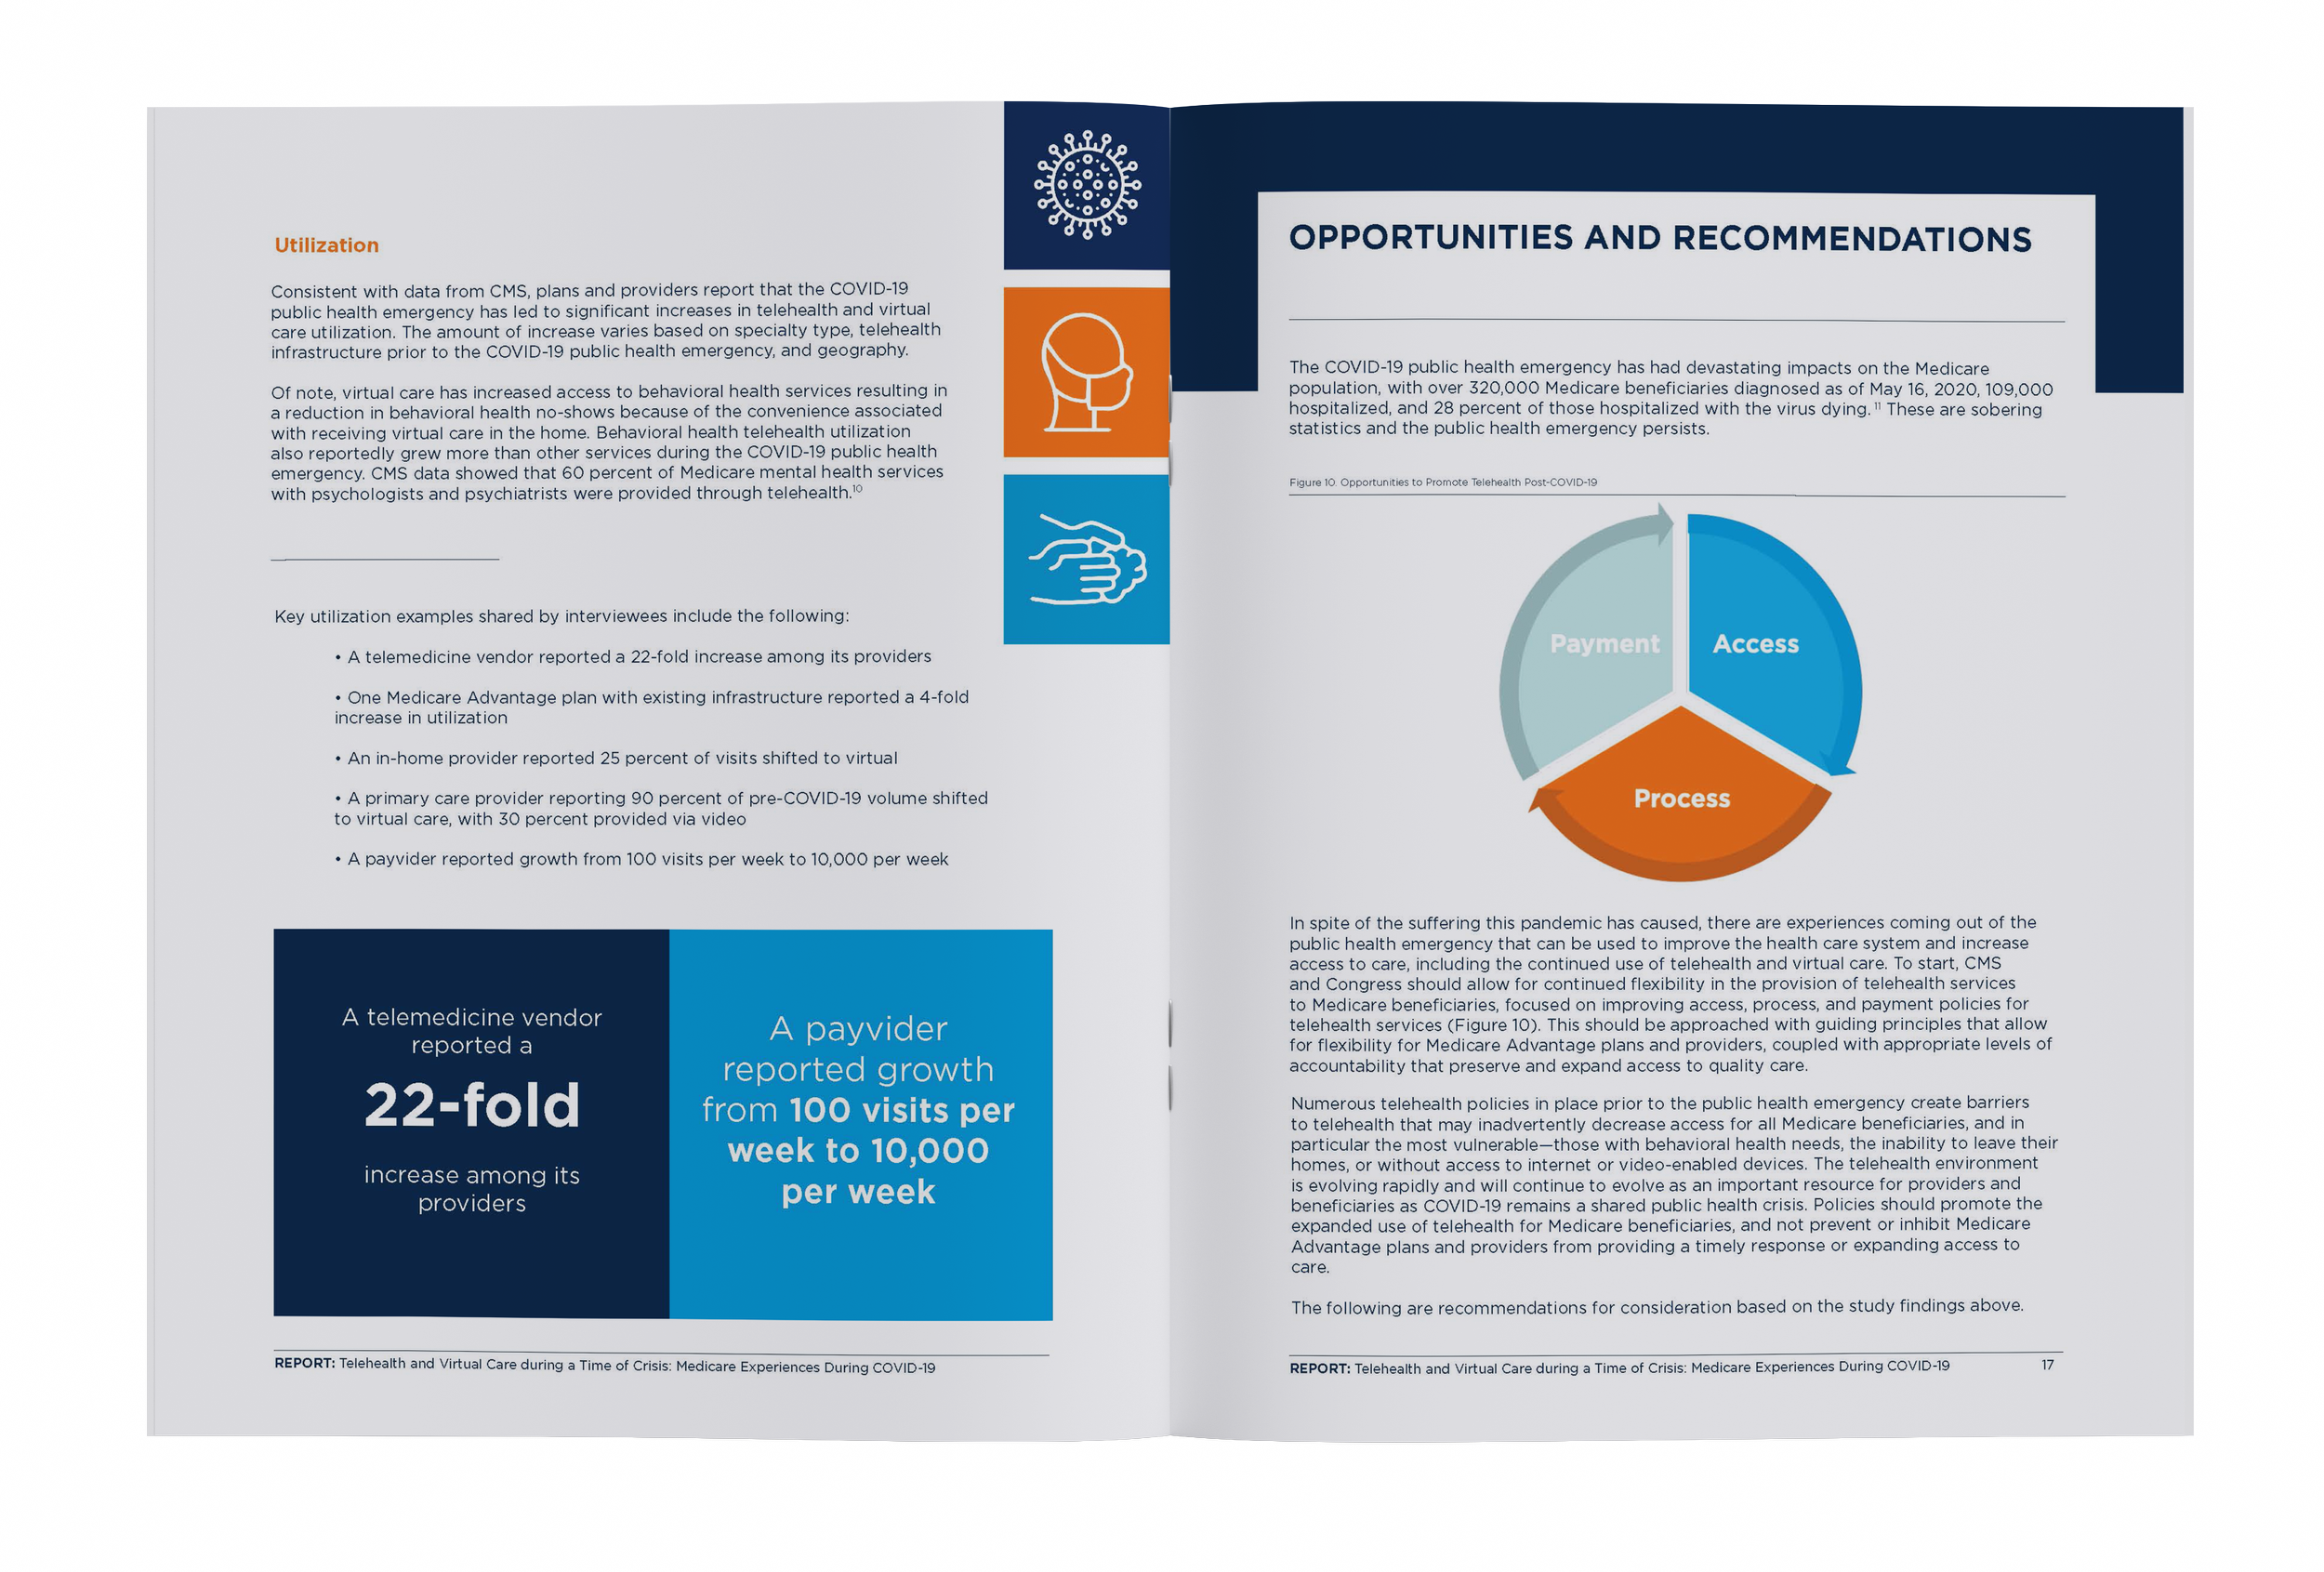
The final publication transformed a research-heavy document into a cohesive, visually engaging report. Original infographics and data visualizations helped communicate complex healthcare information while maintaining consistency with the client's brand.
The Outcome
Explore The Full Report Below
Case Study 2
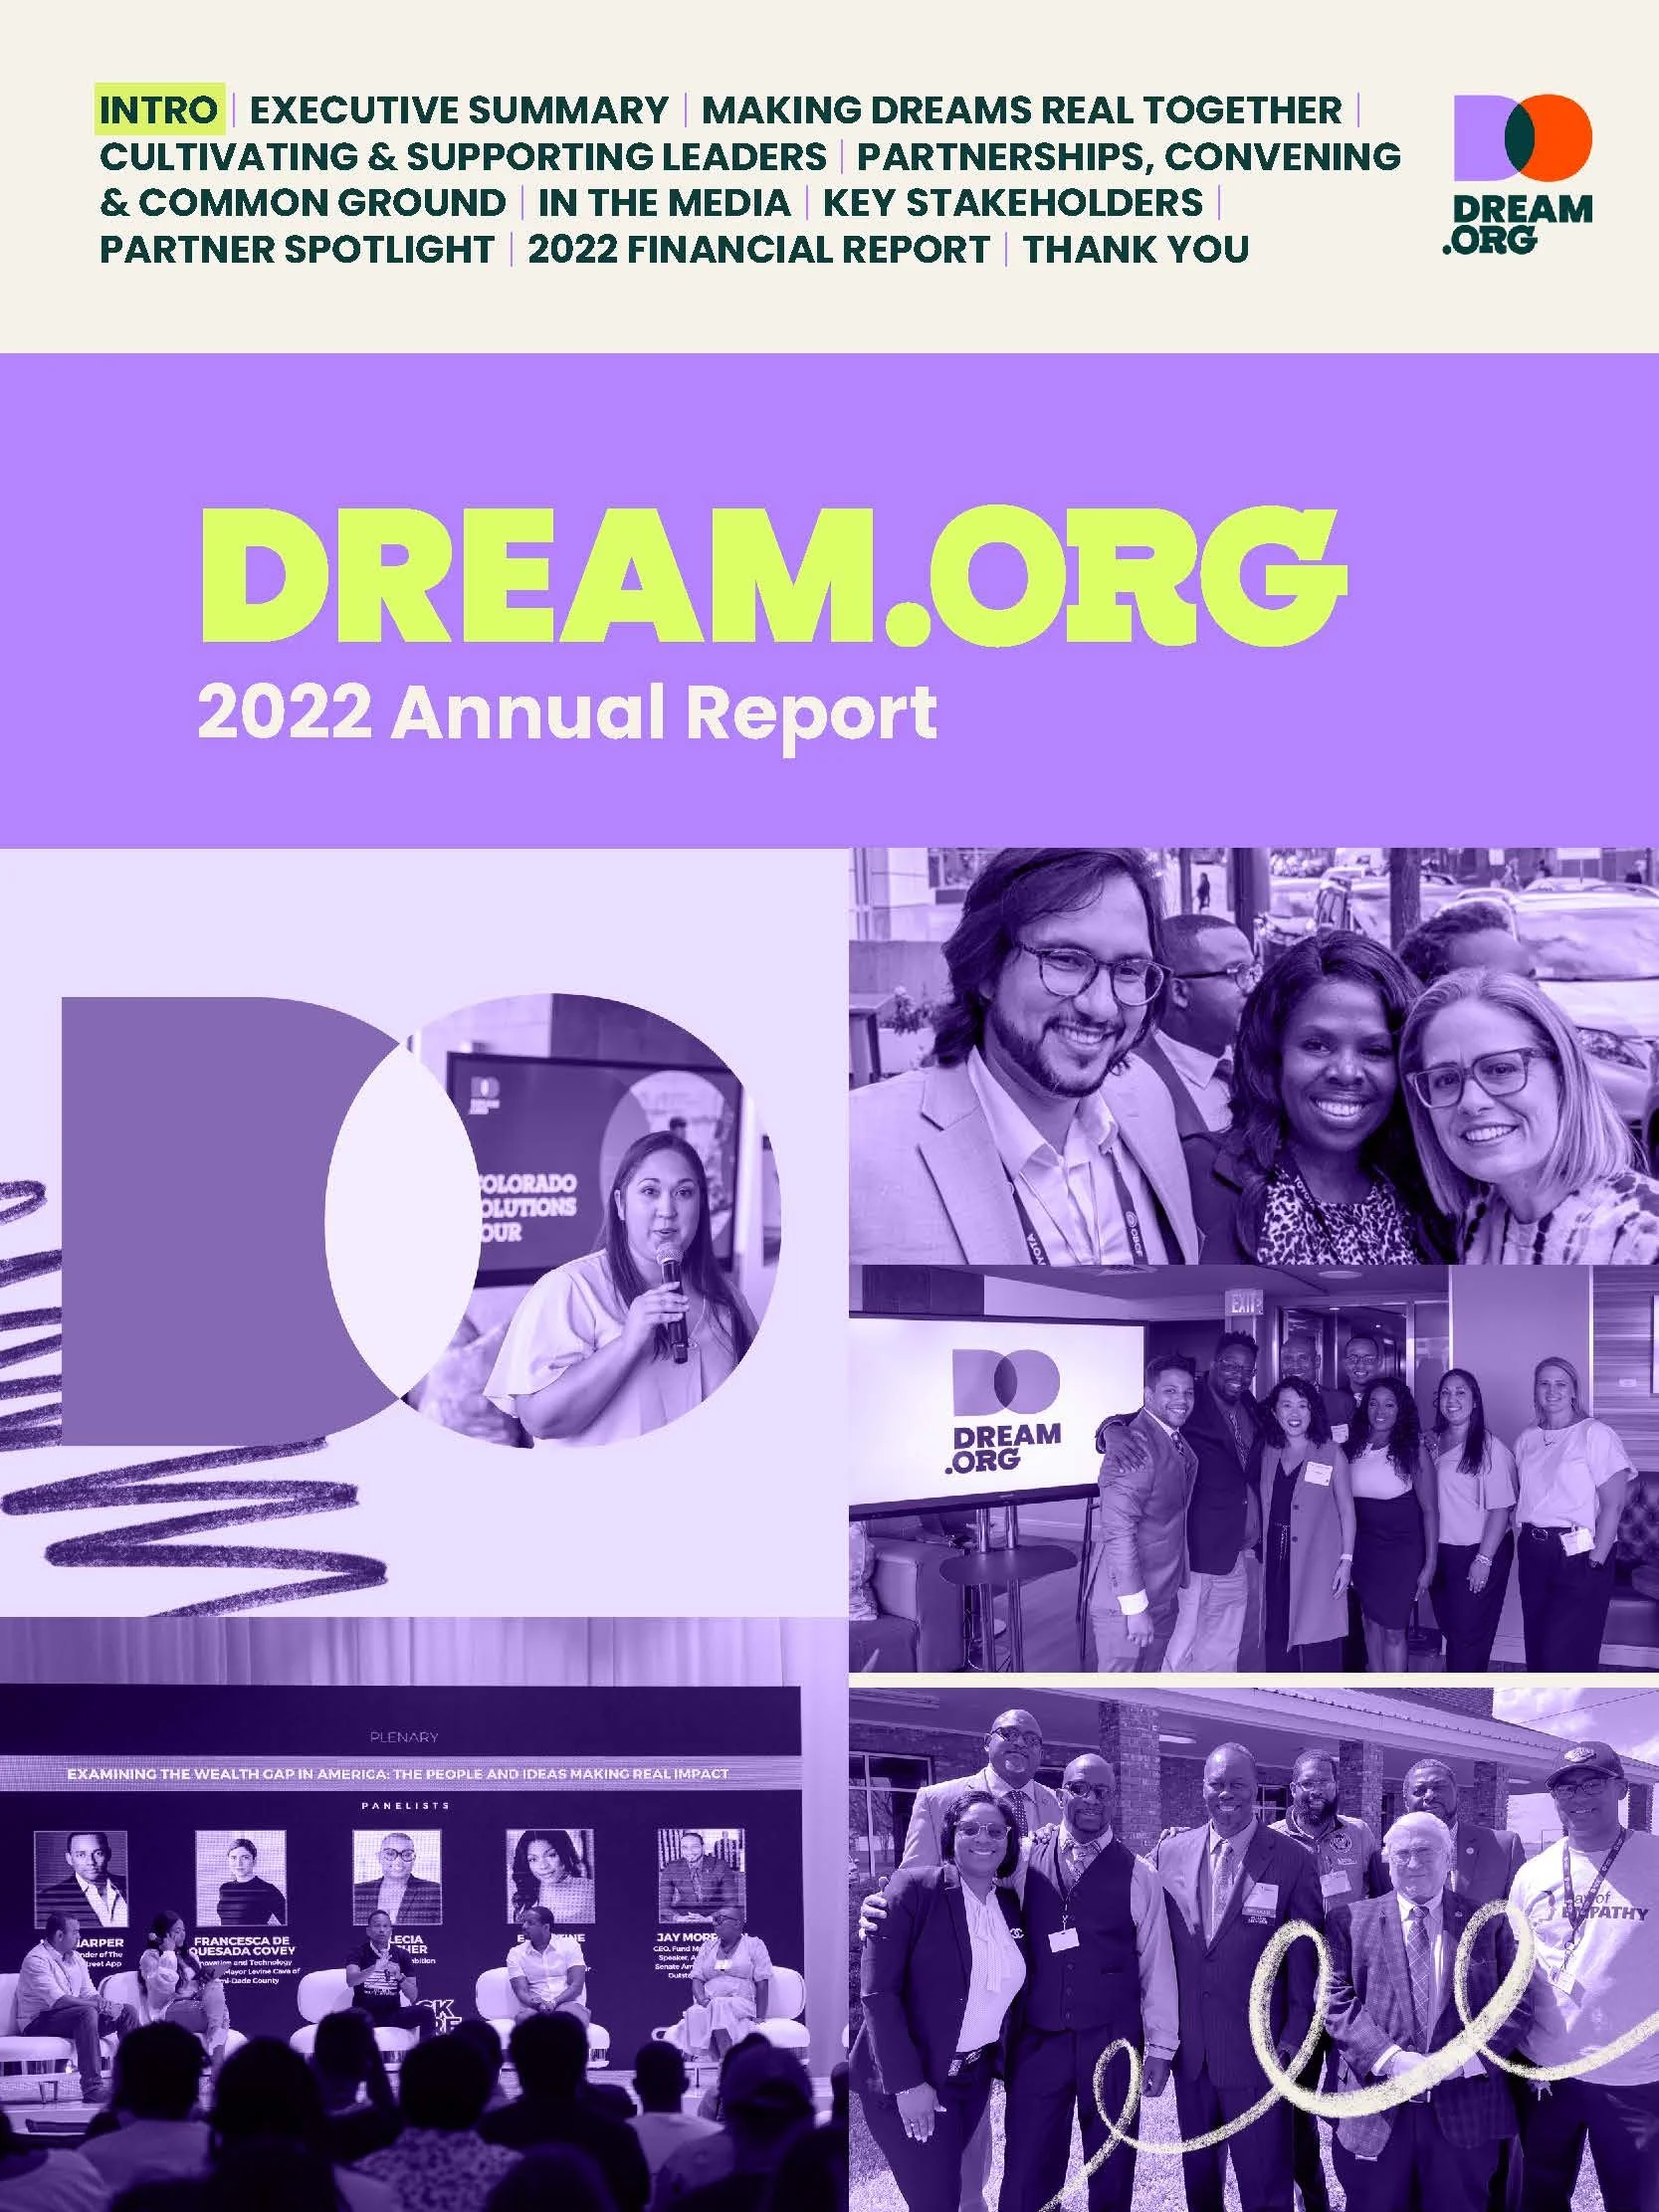
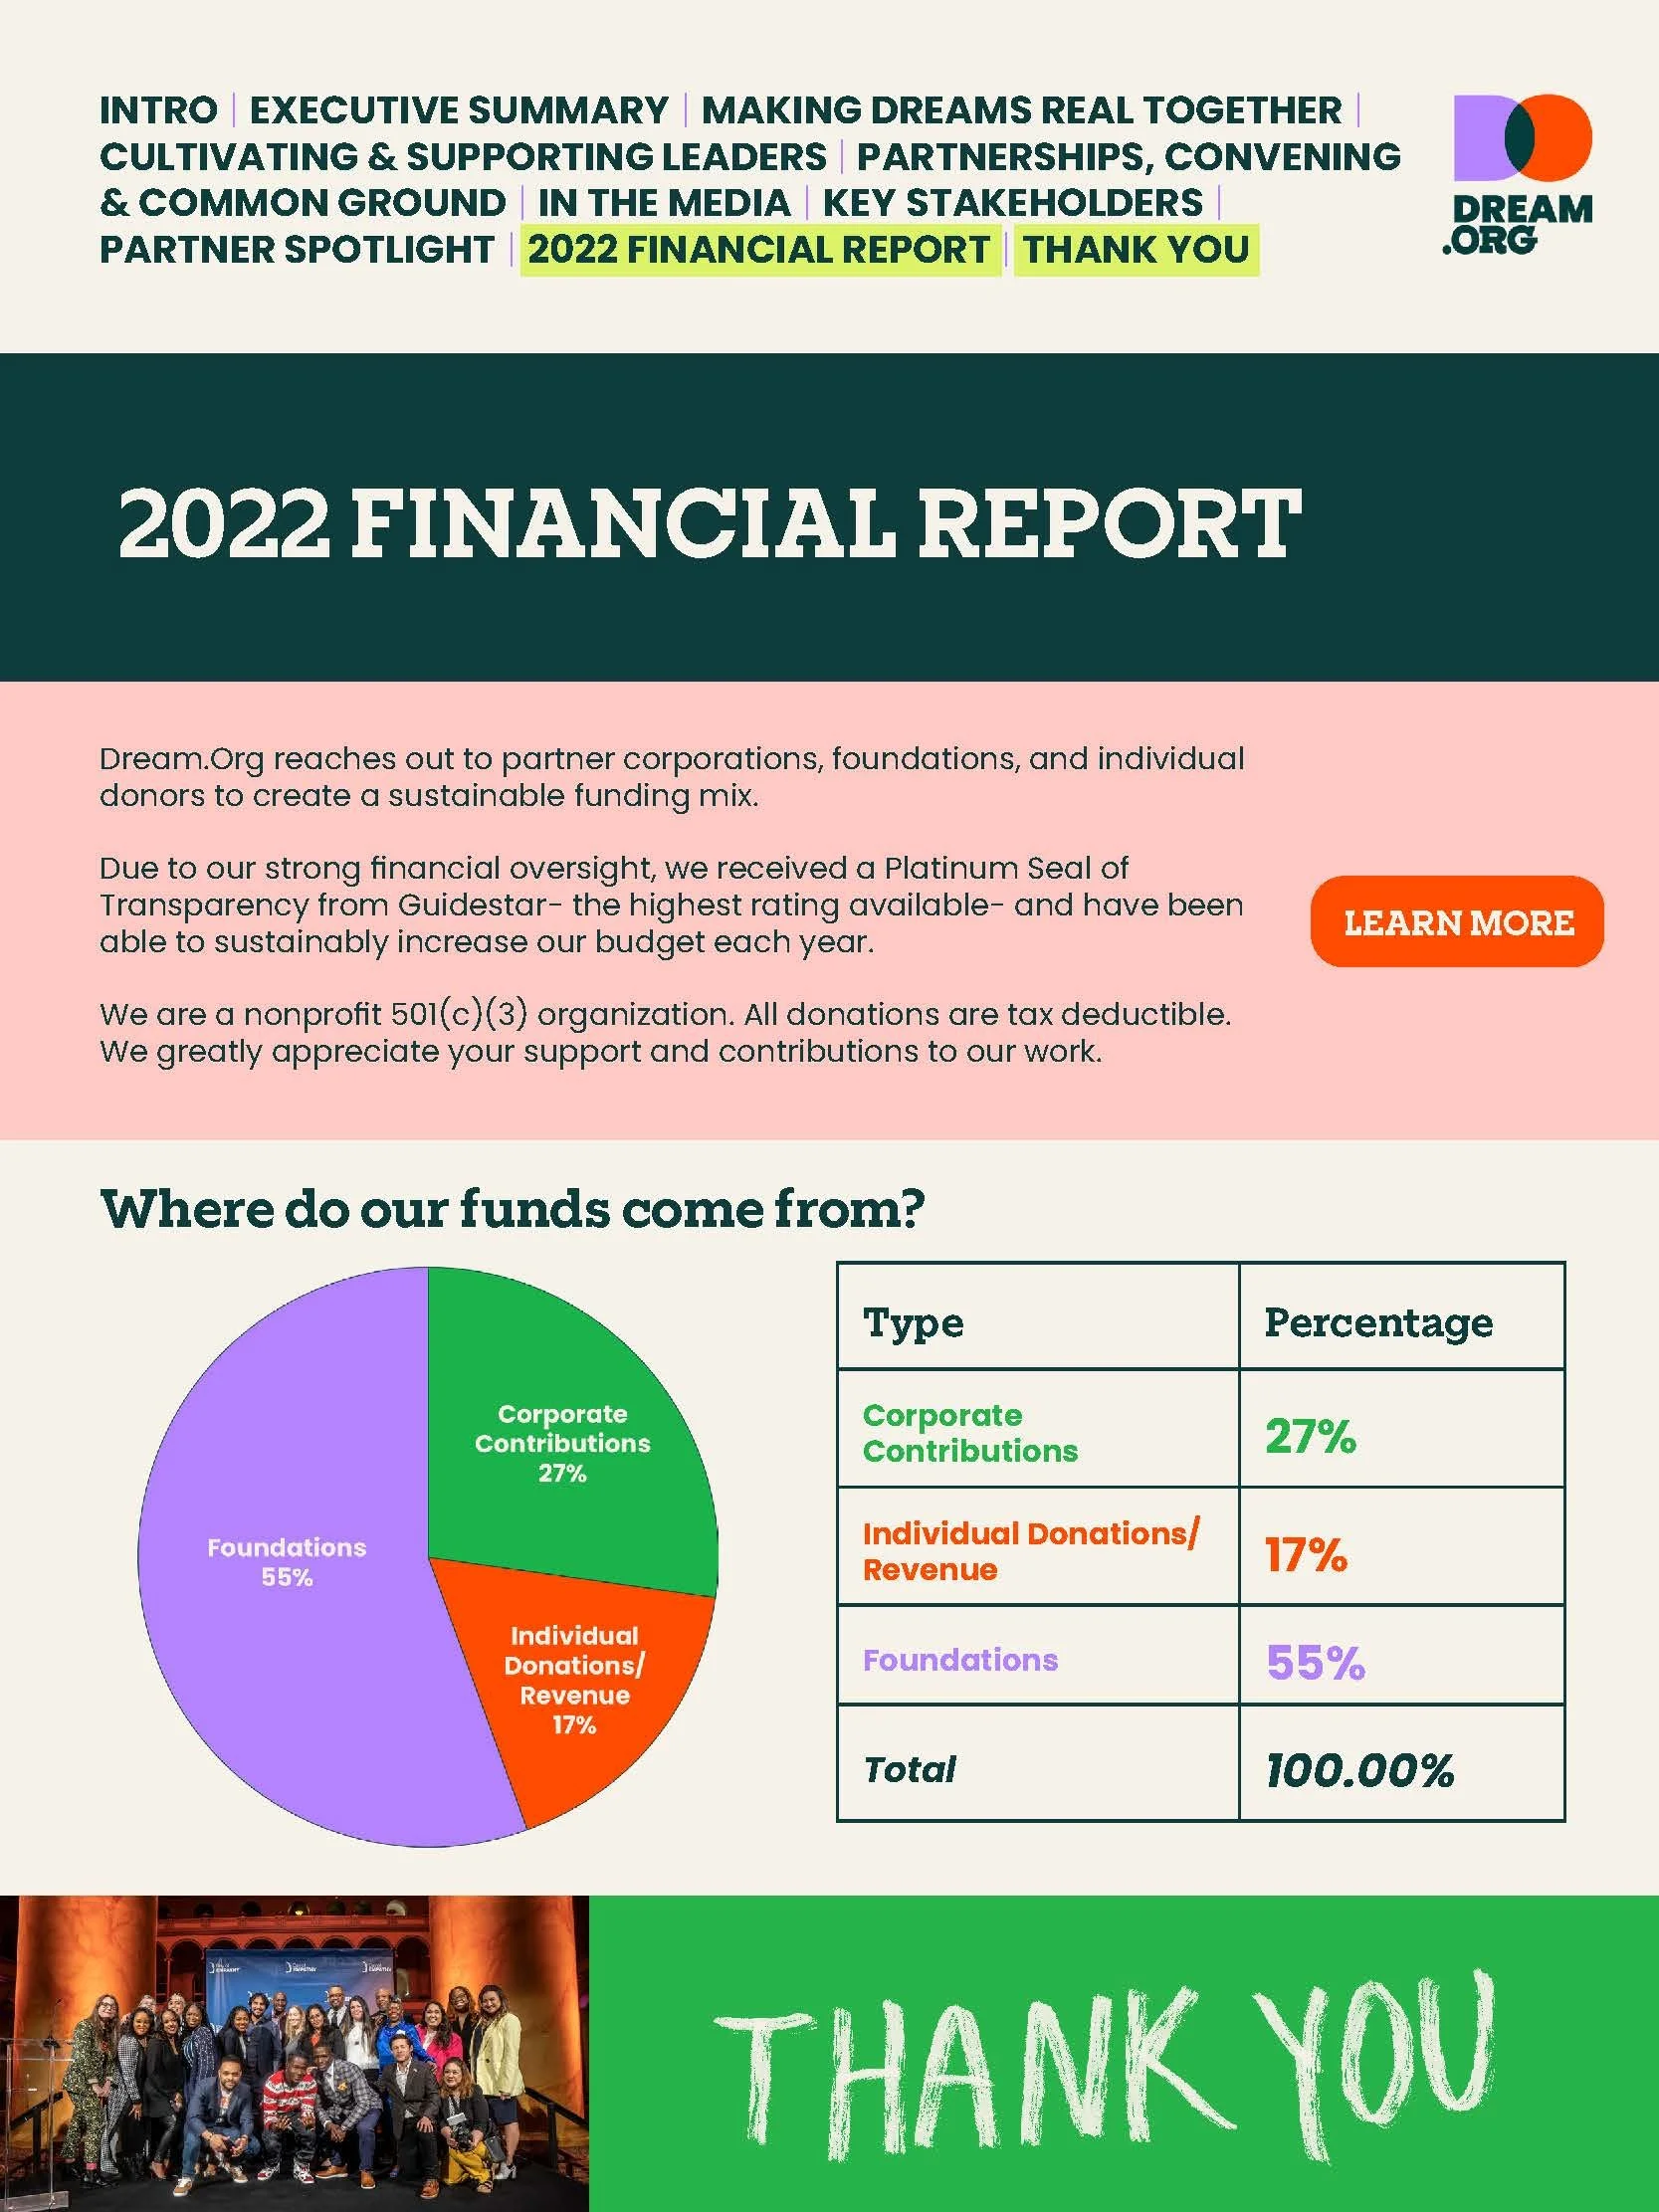
Dream.org
Annual Report
Year: 2022
Deliverables: Multi-page annual report, including editorial layouts, hand-drawn custom graphics, data visualizations
The Brief
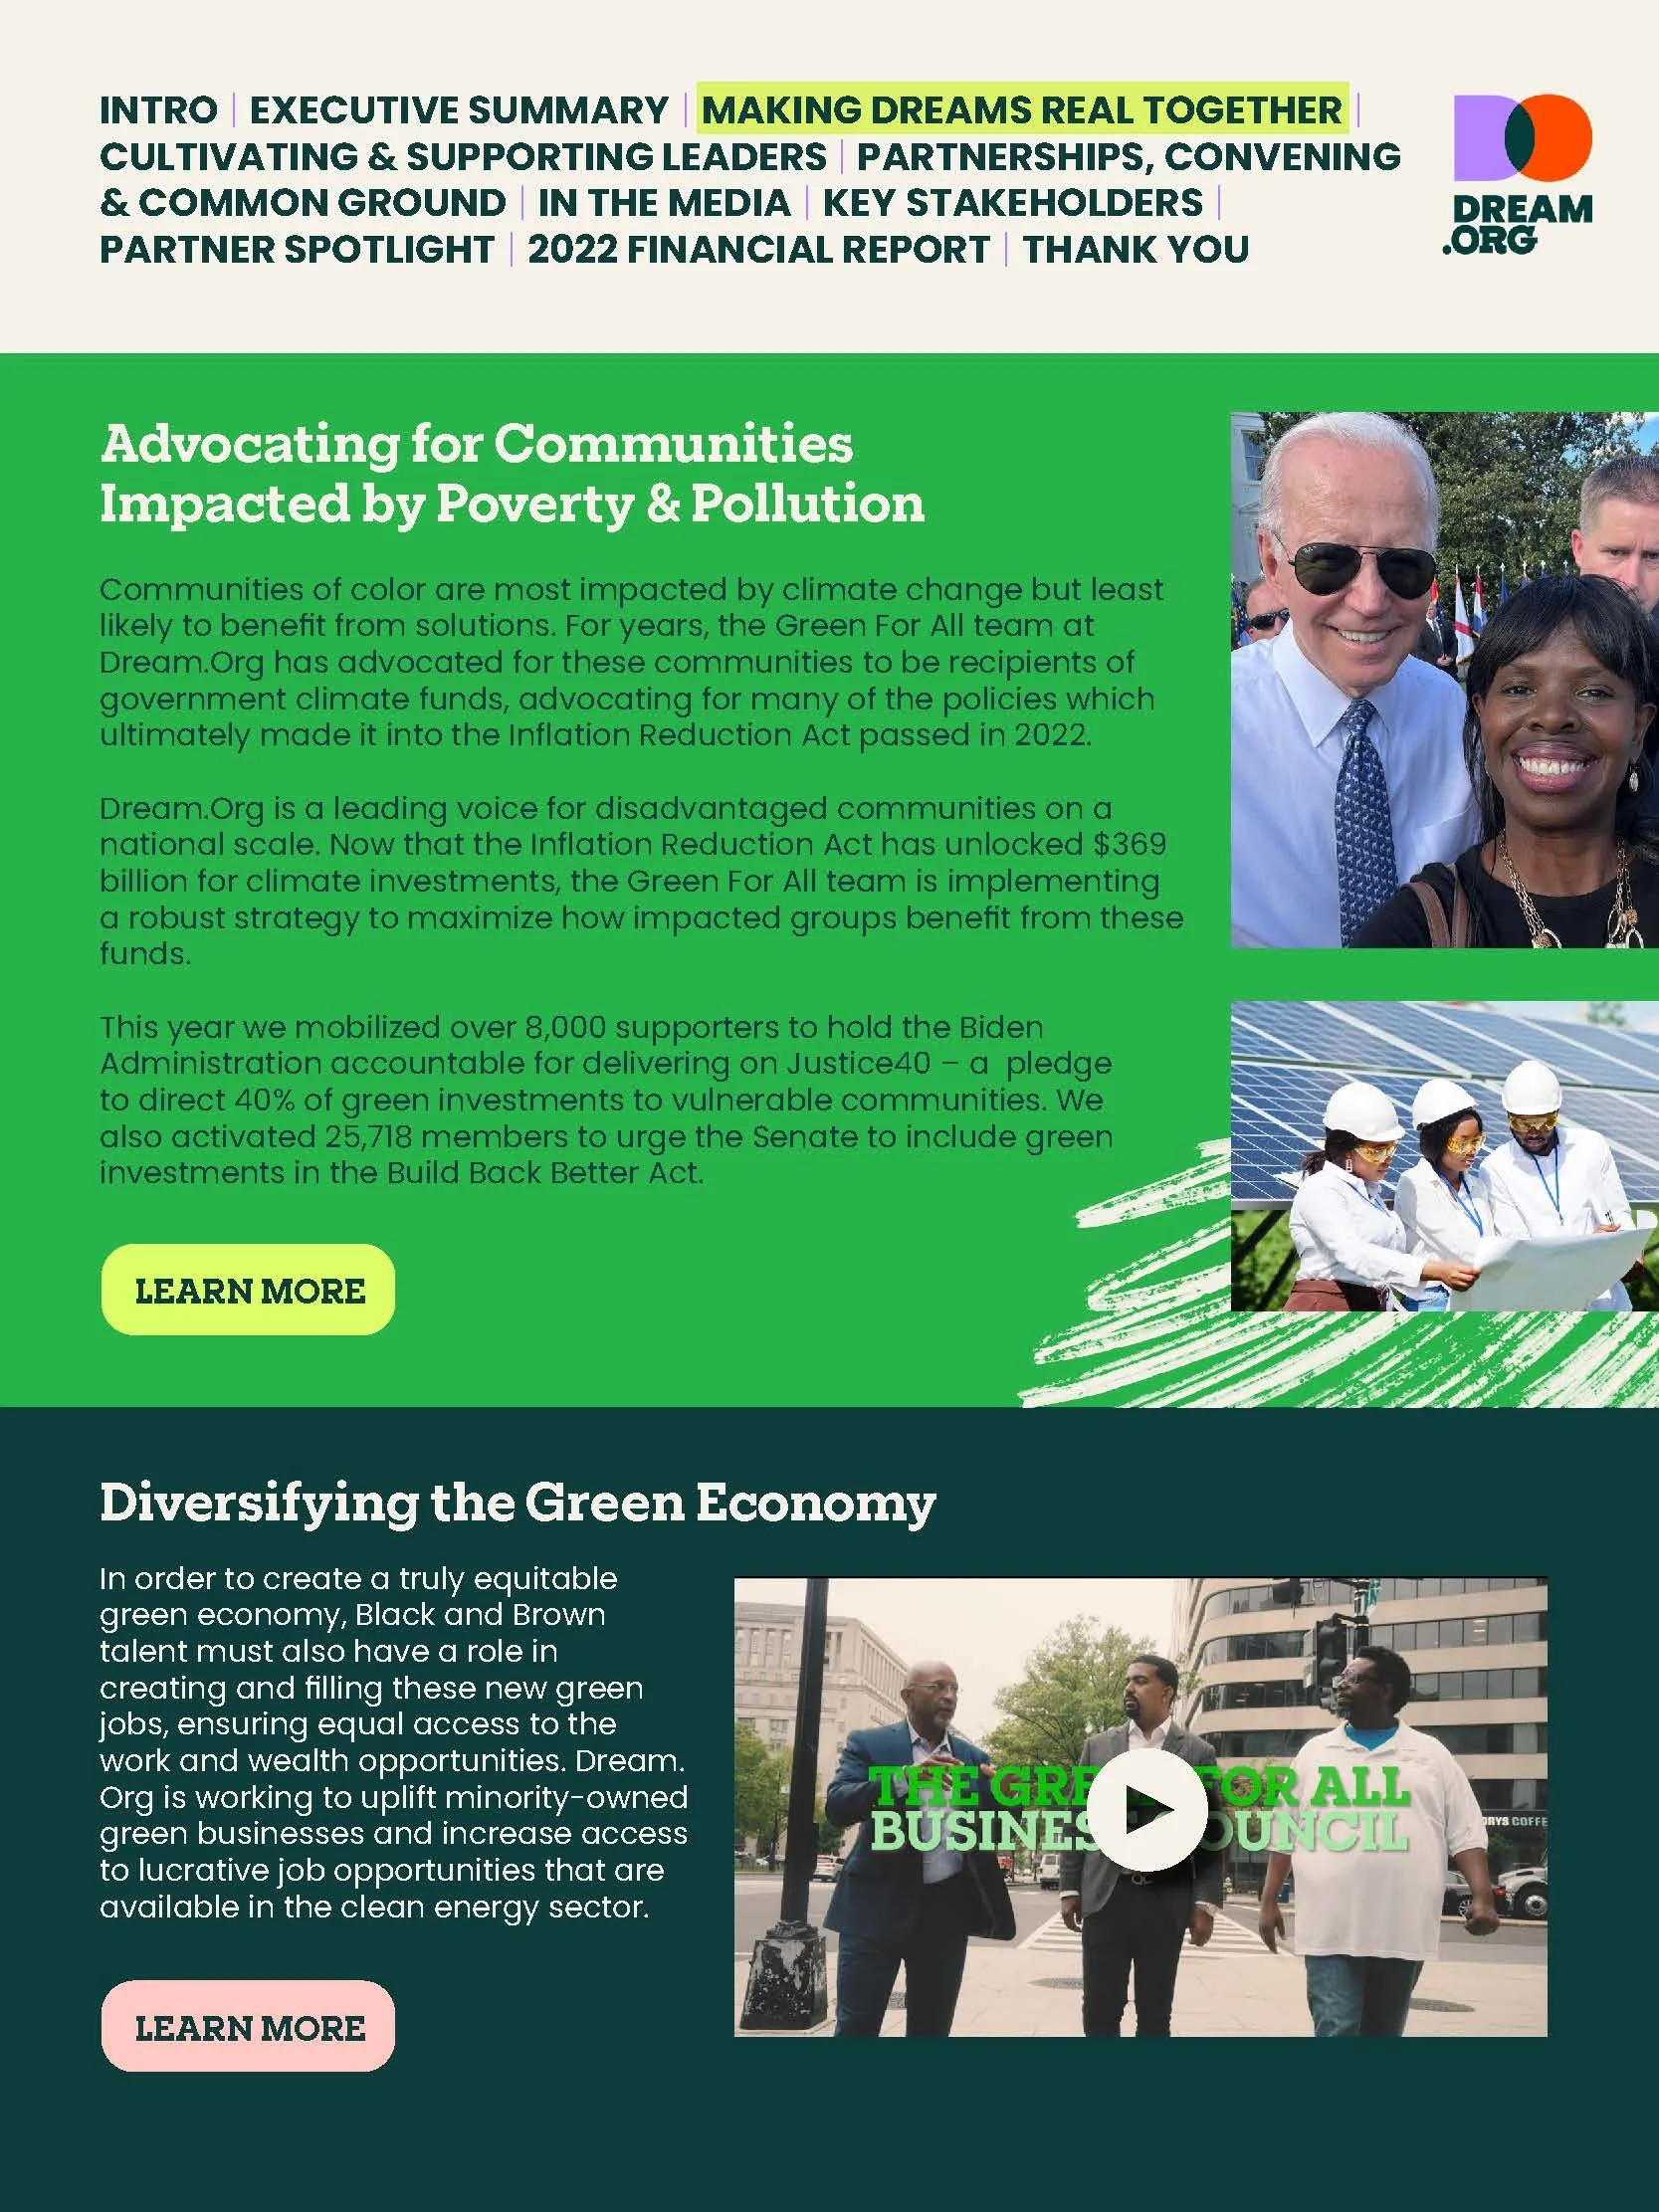
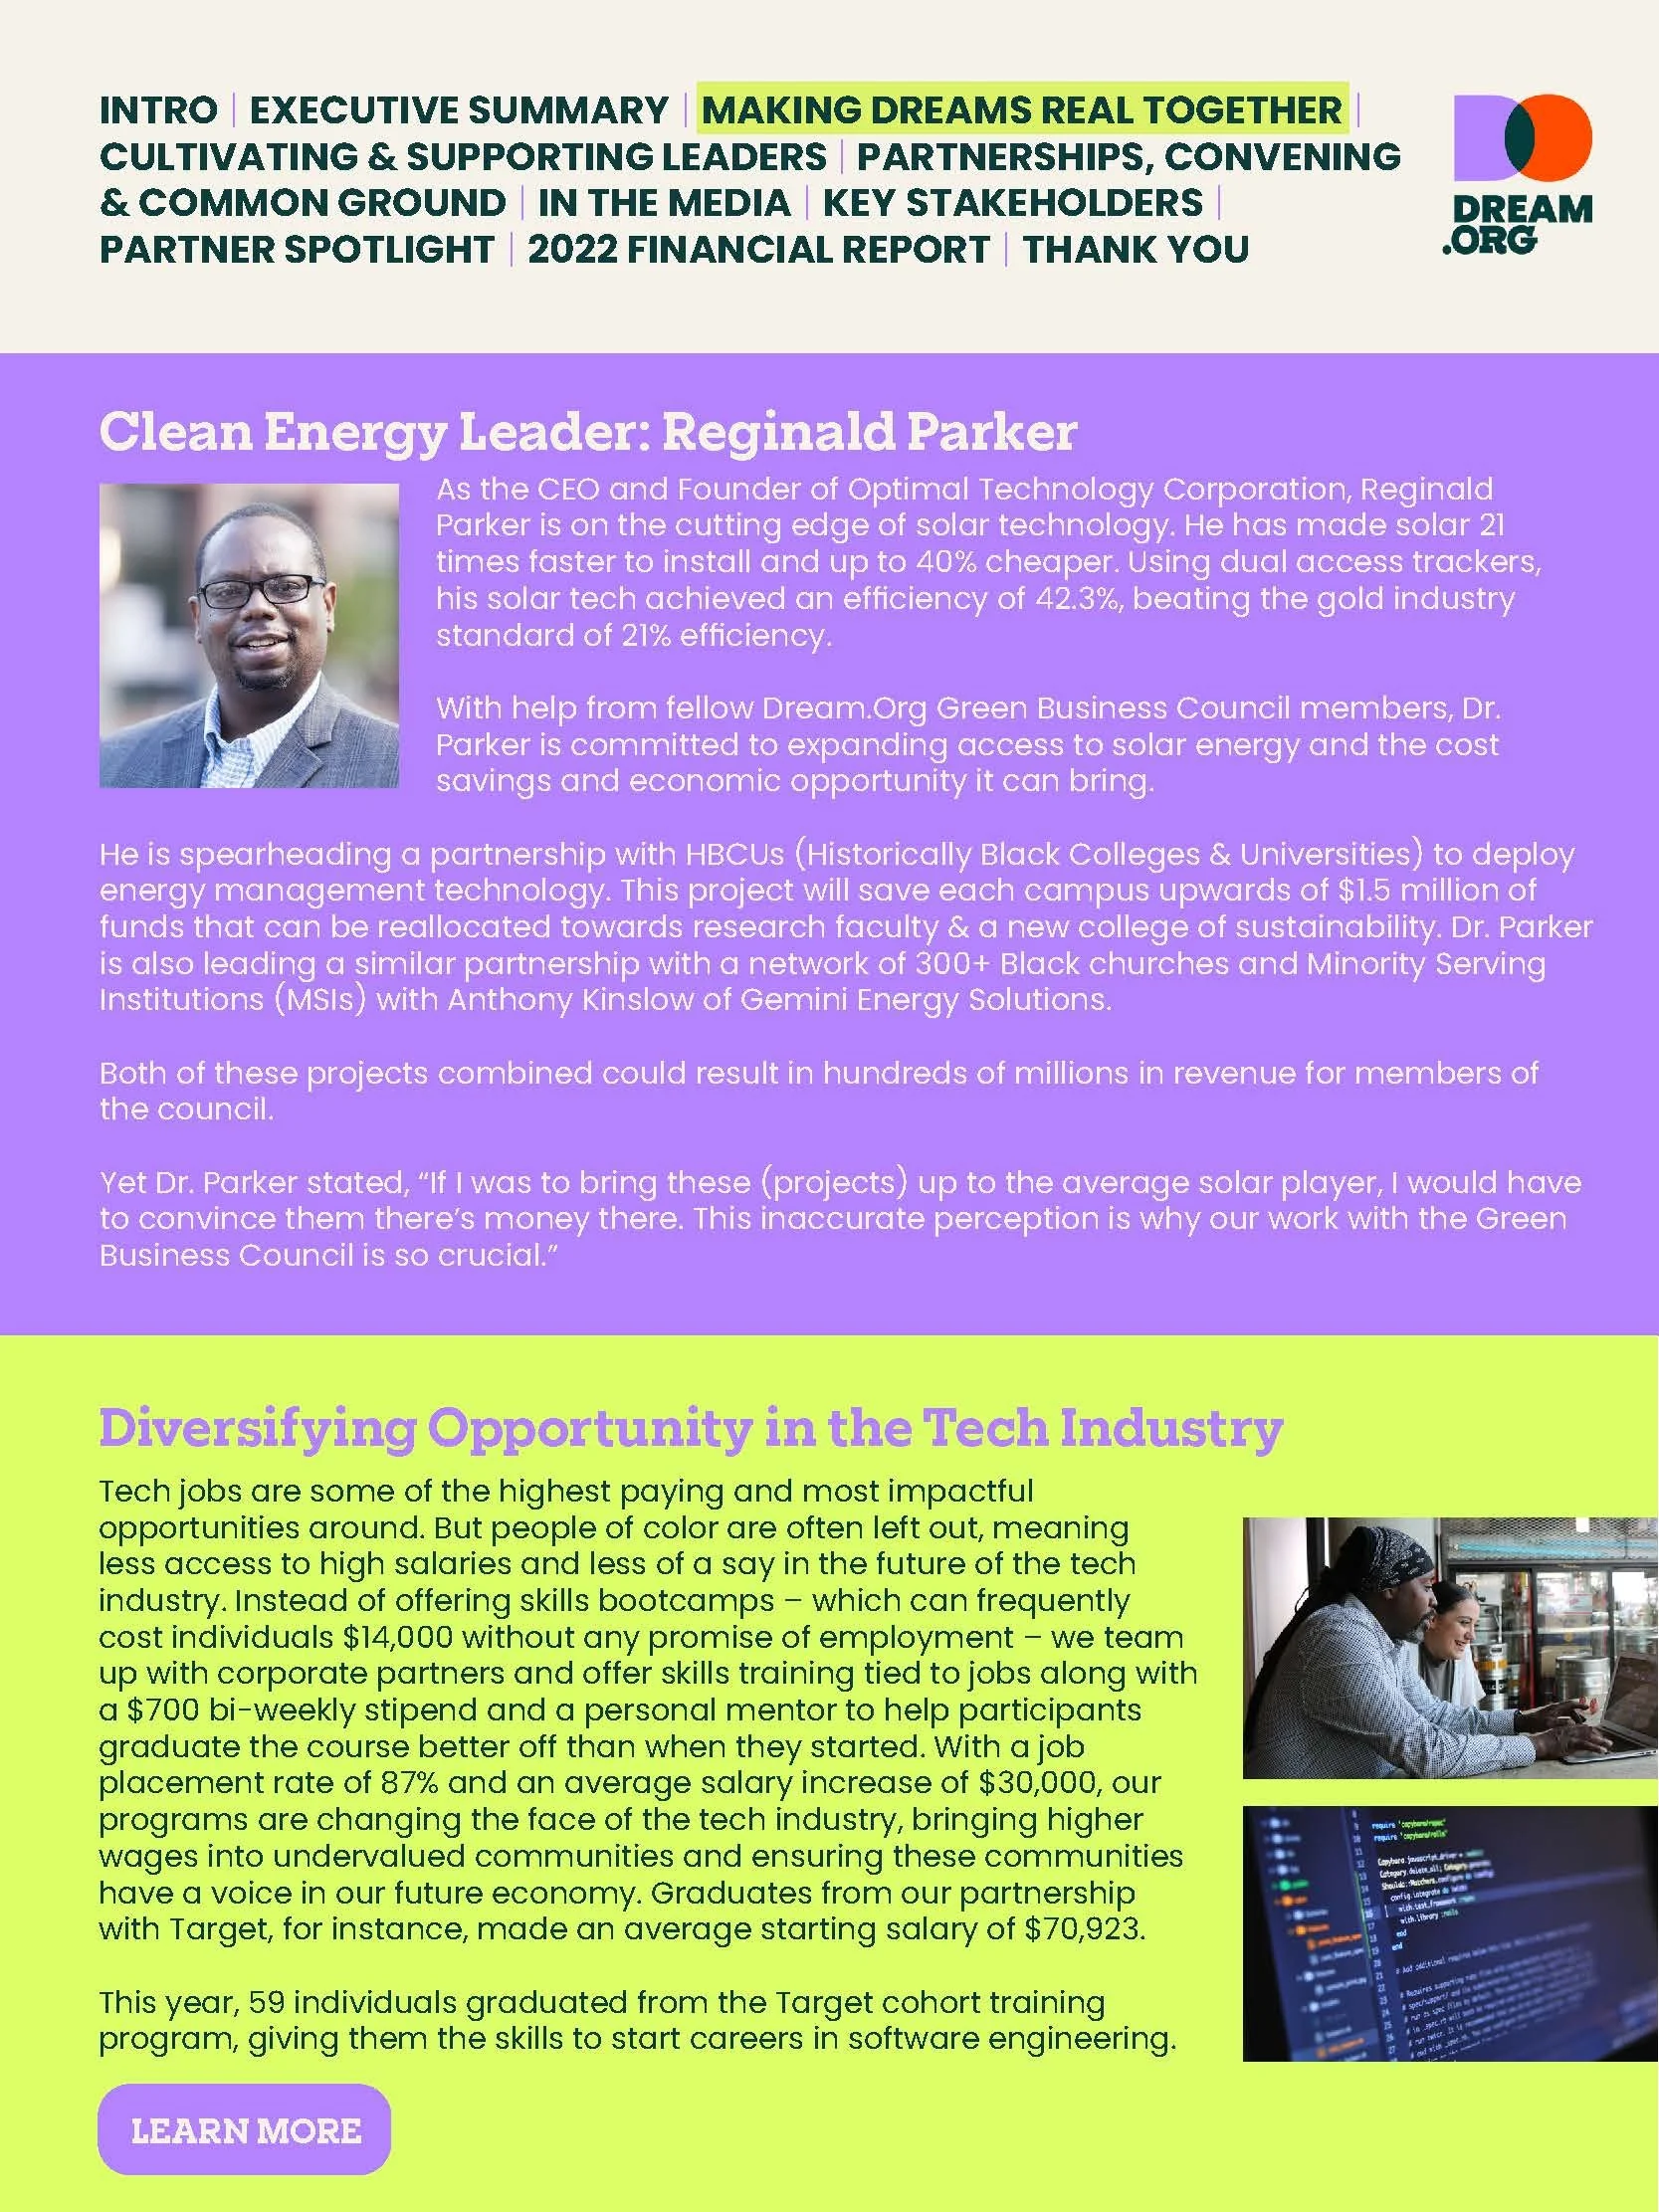
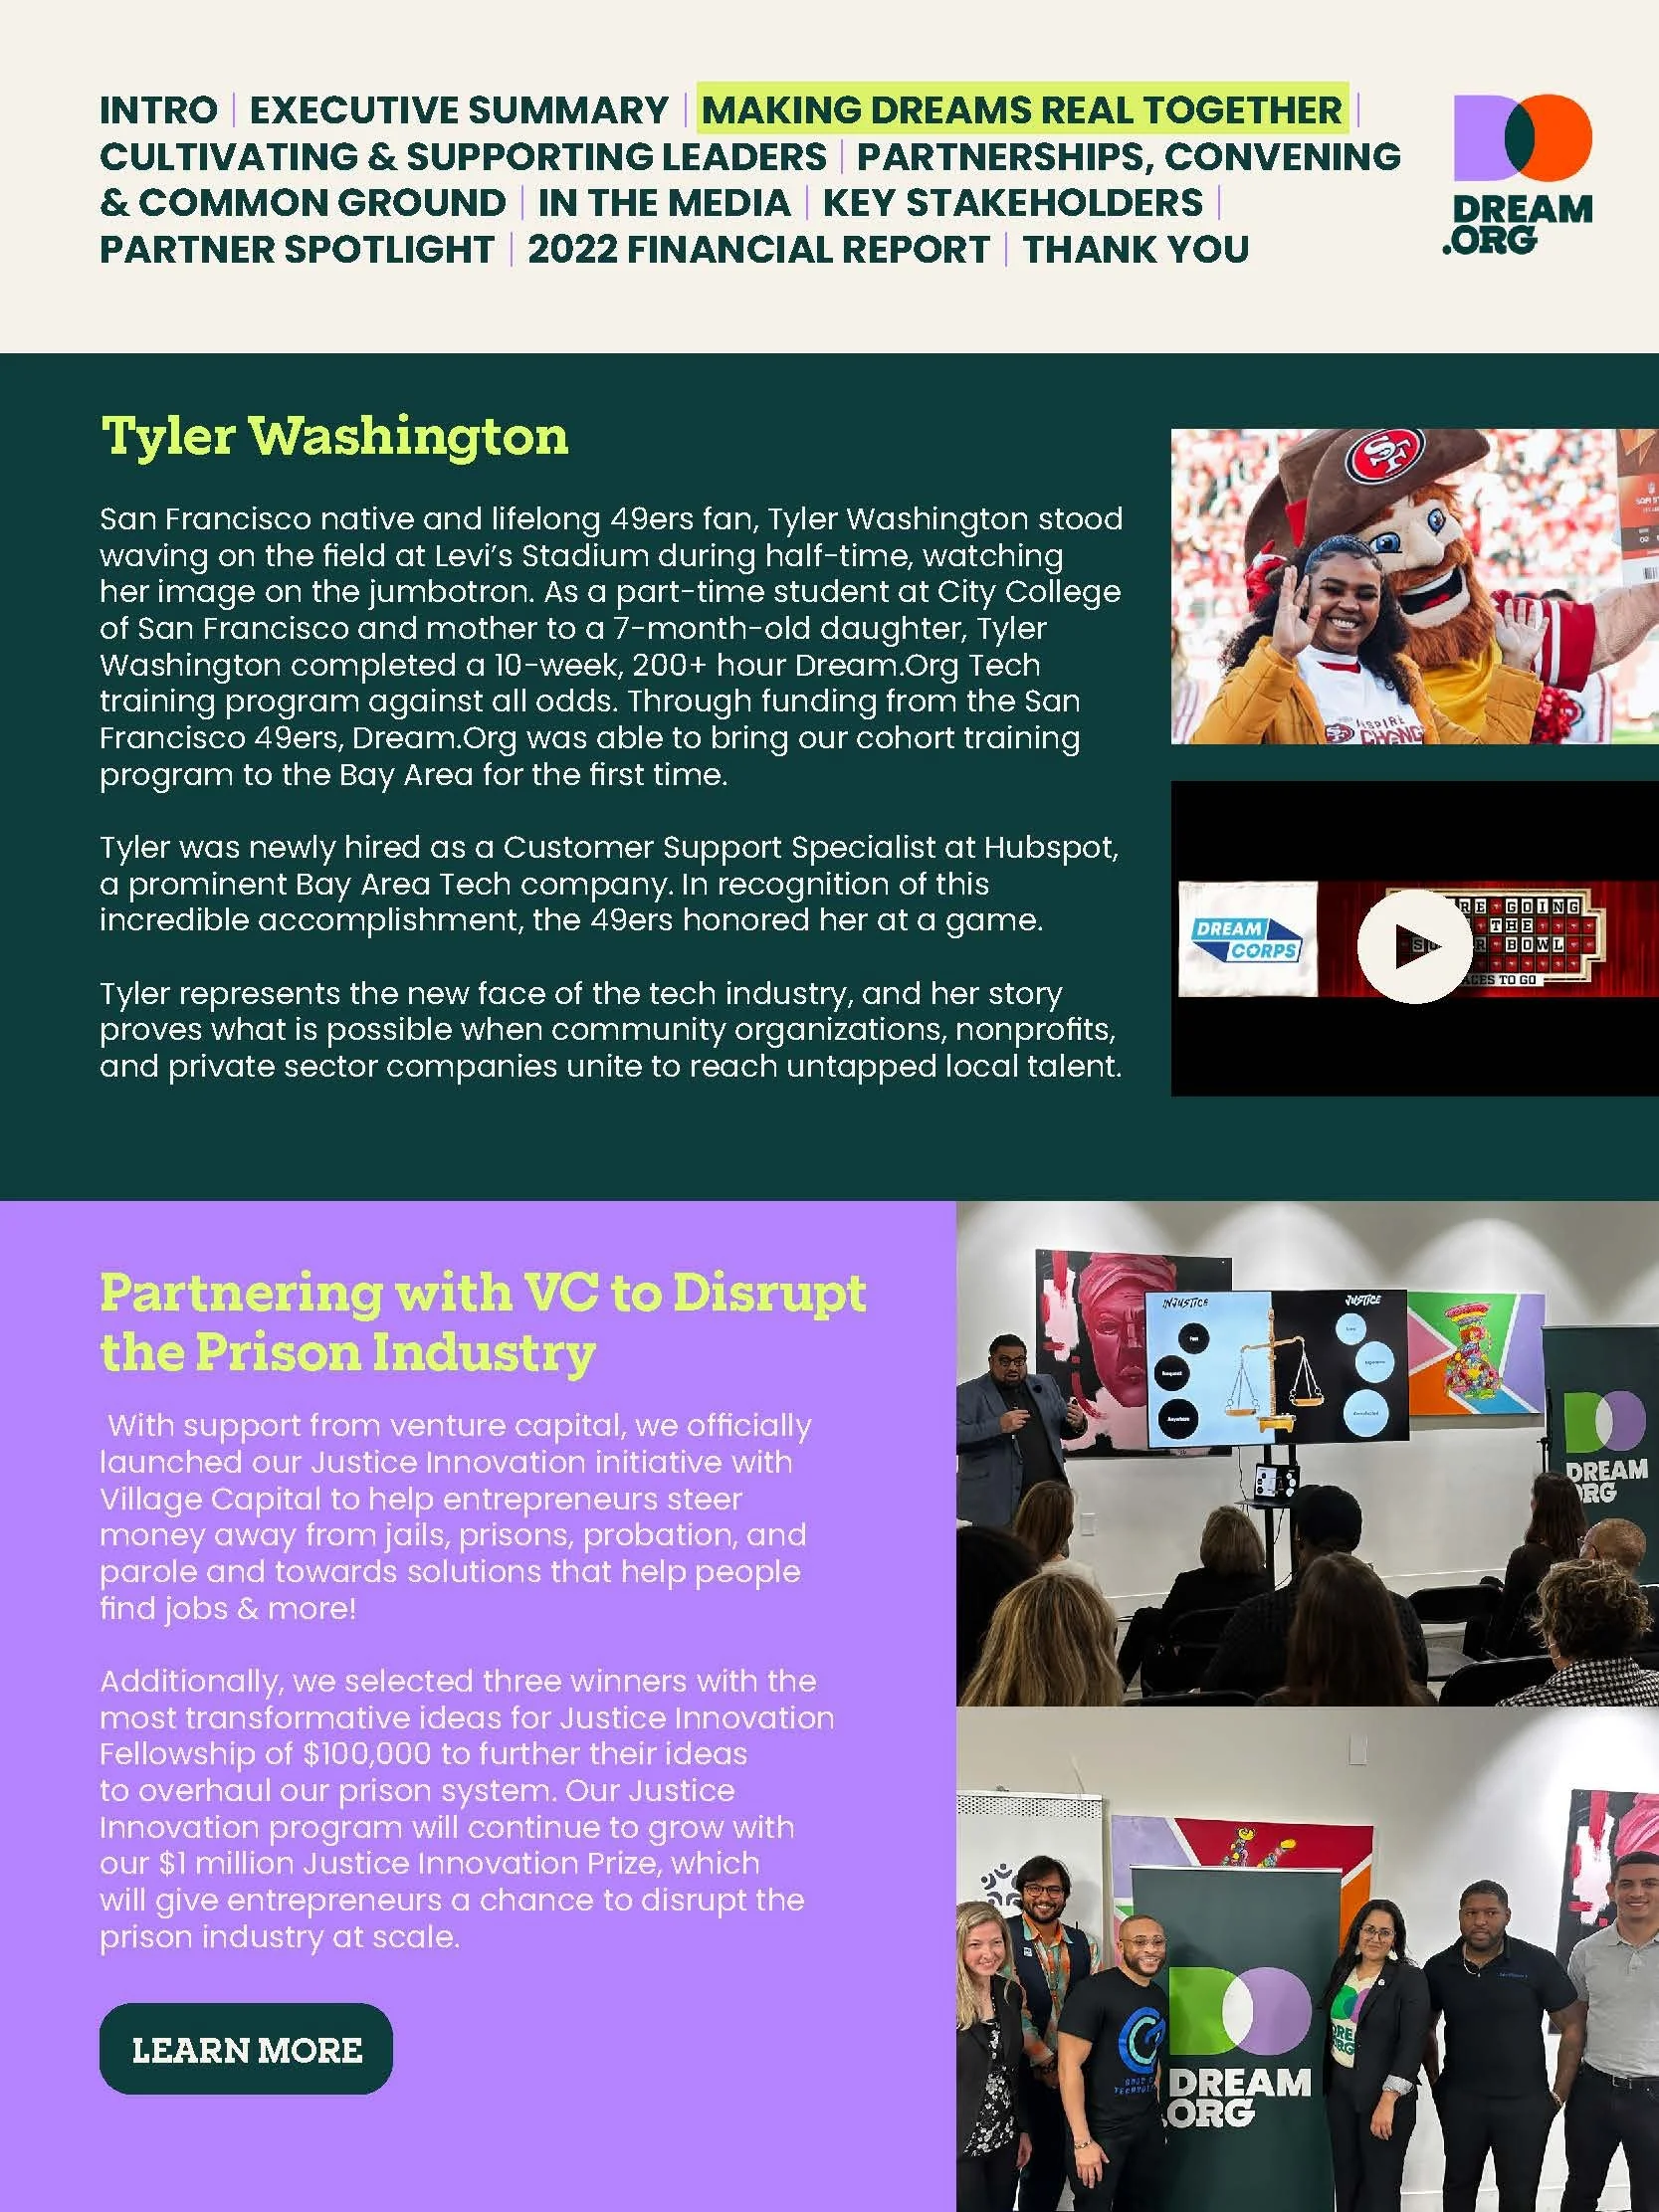
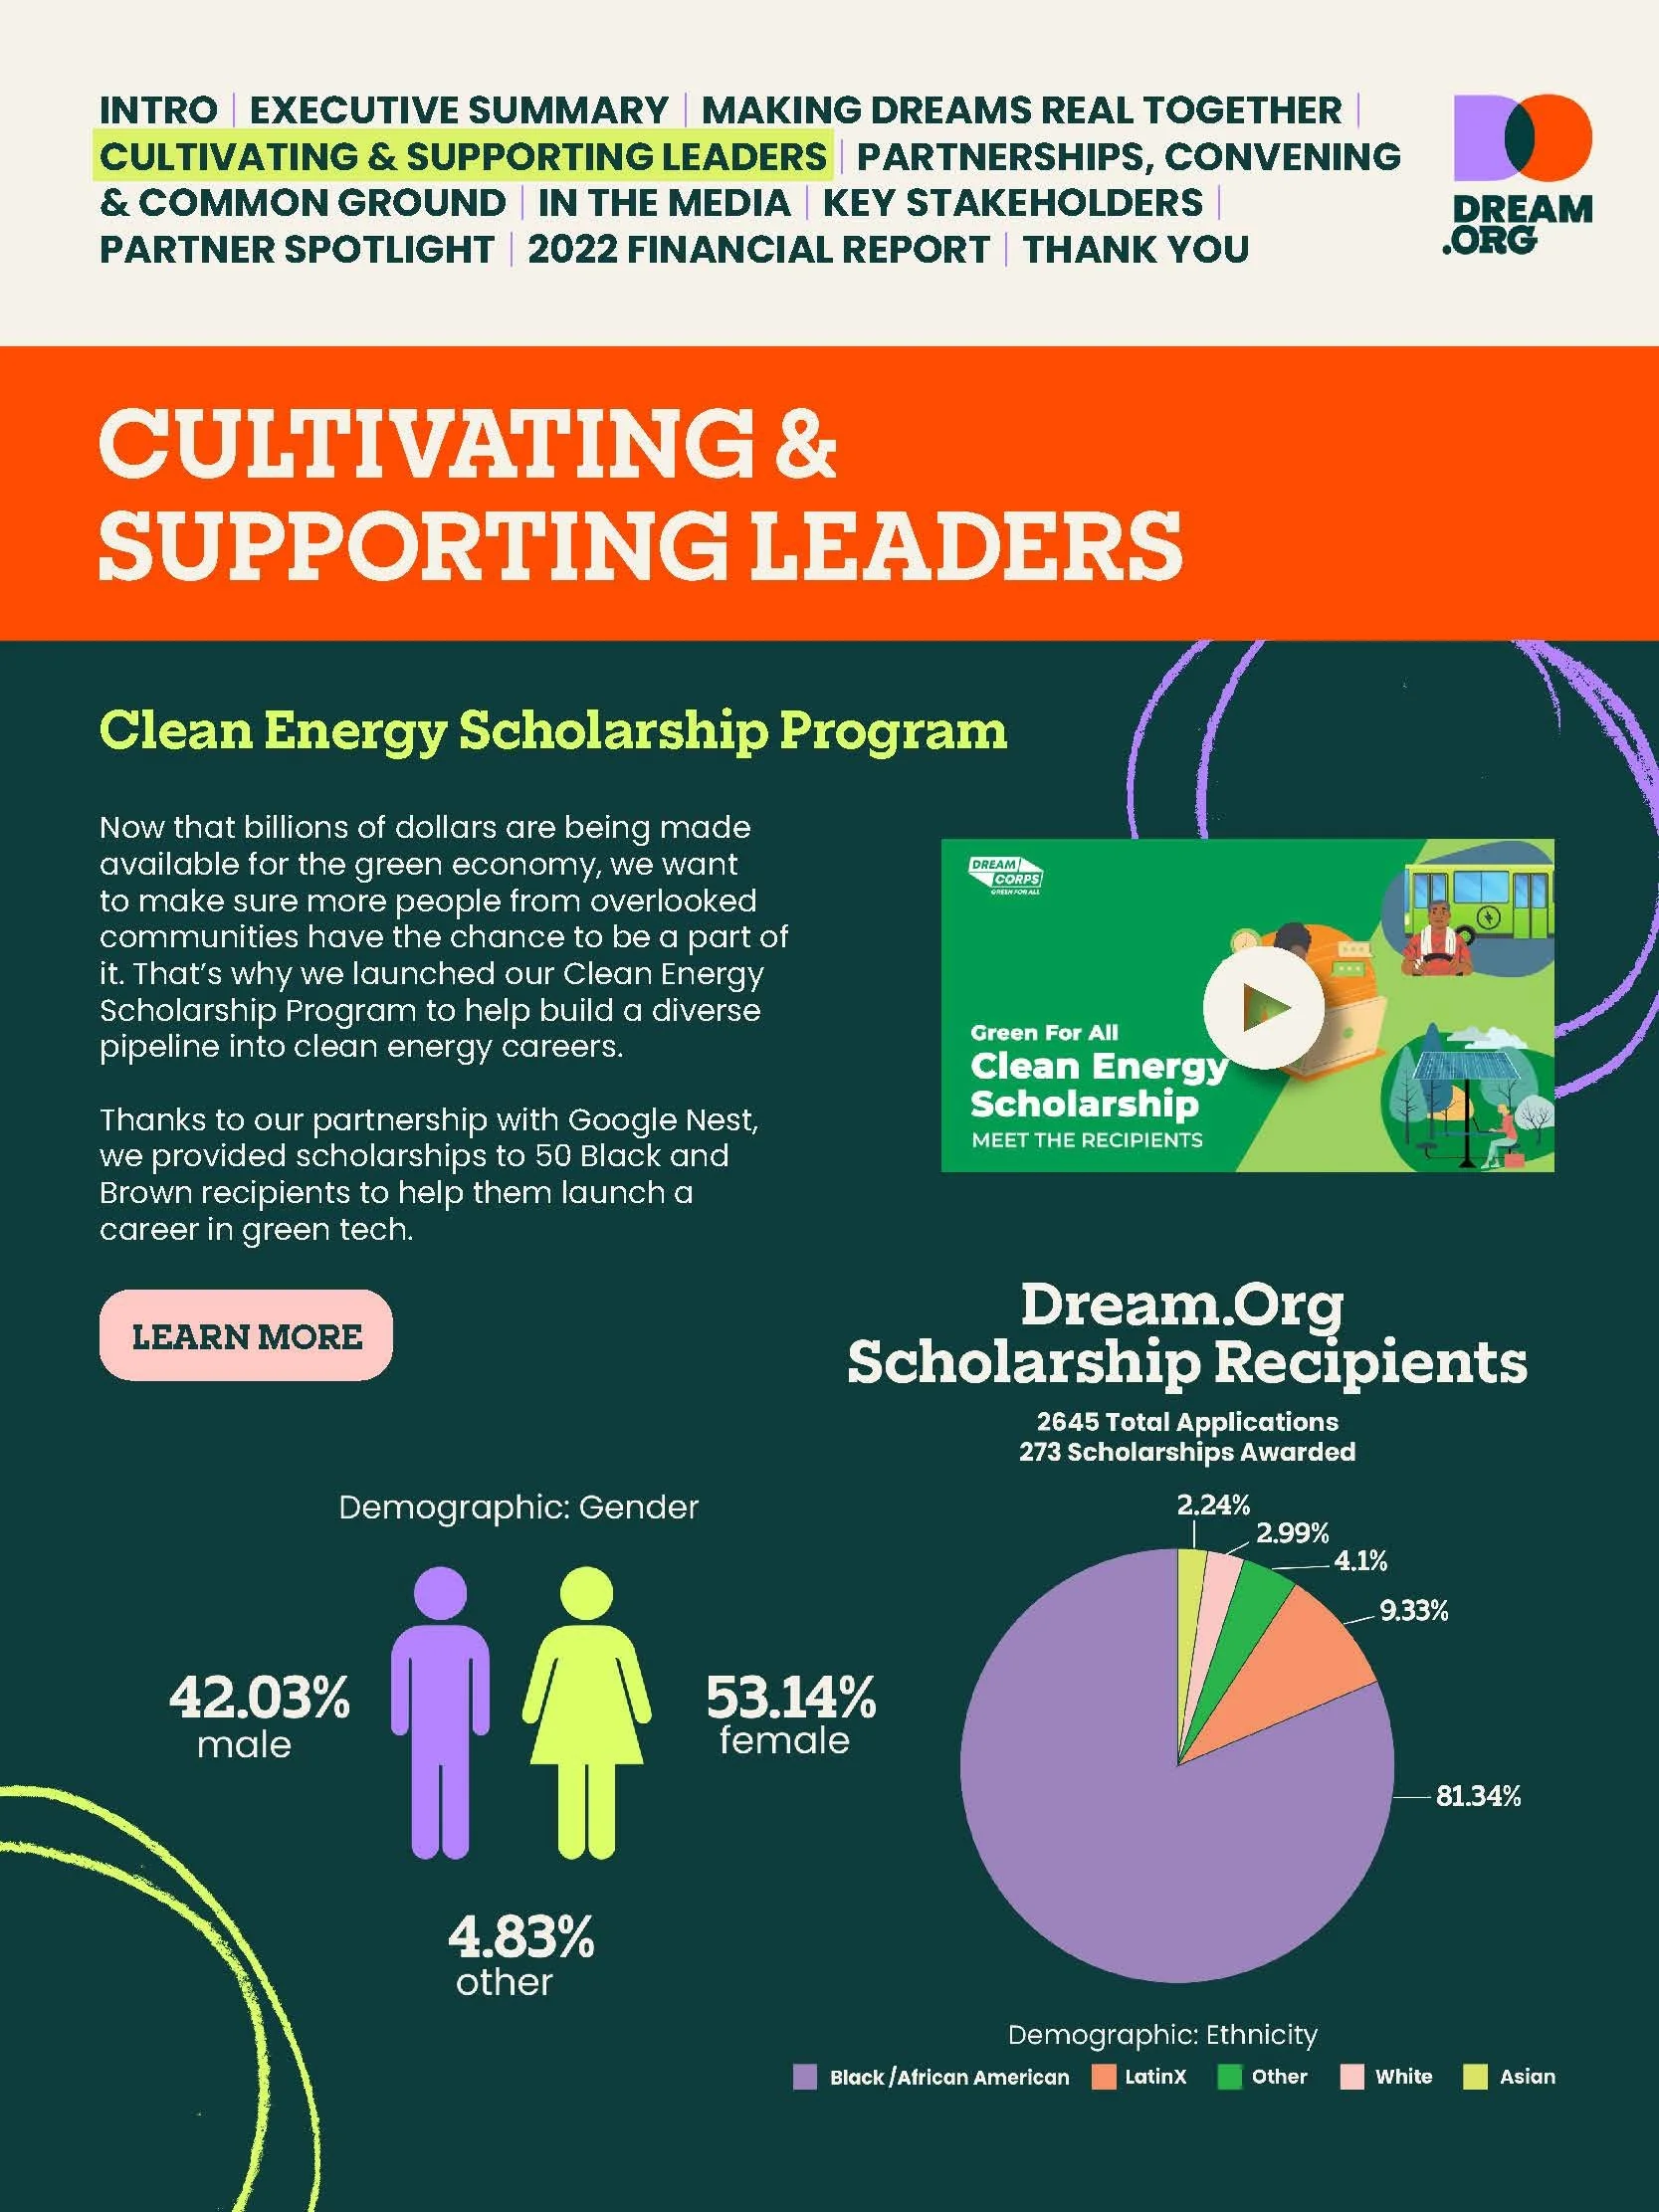
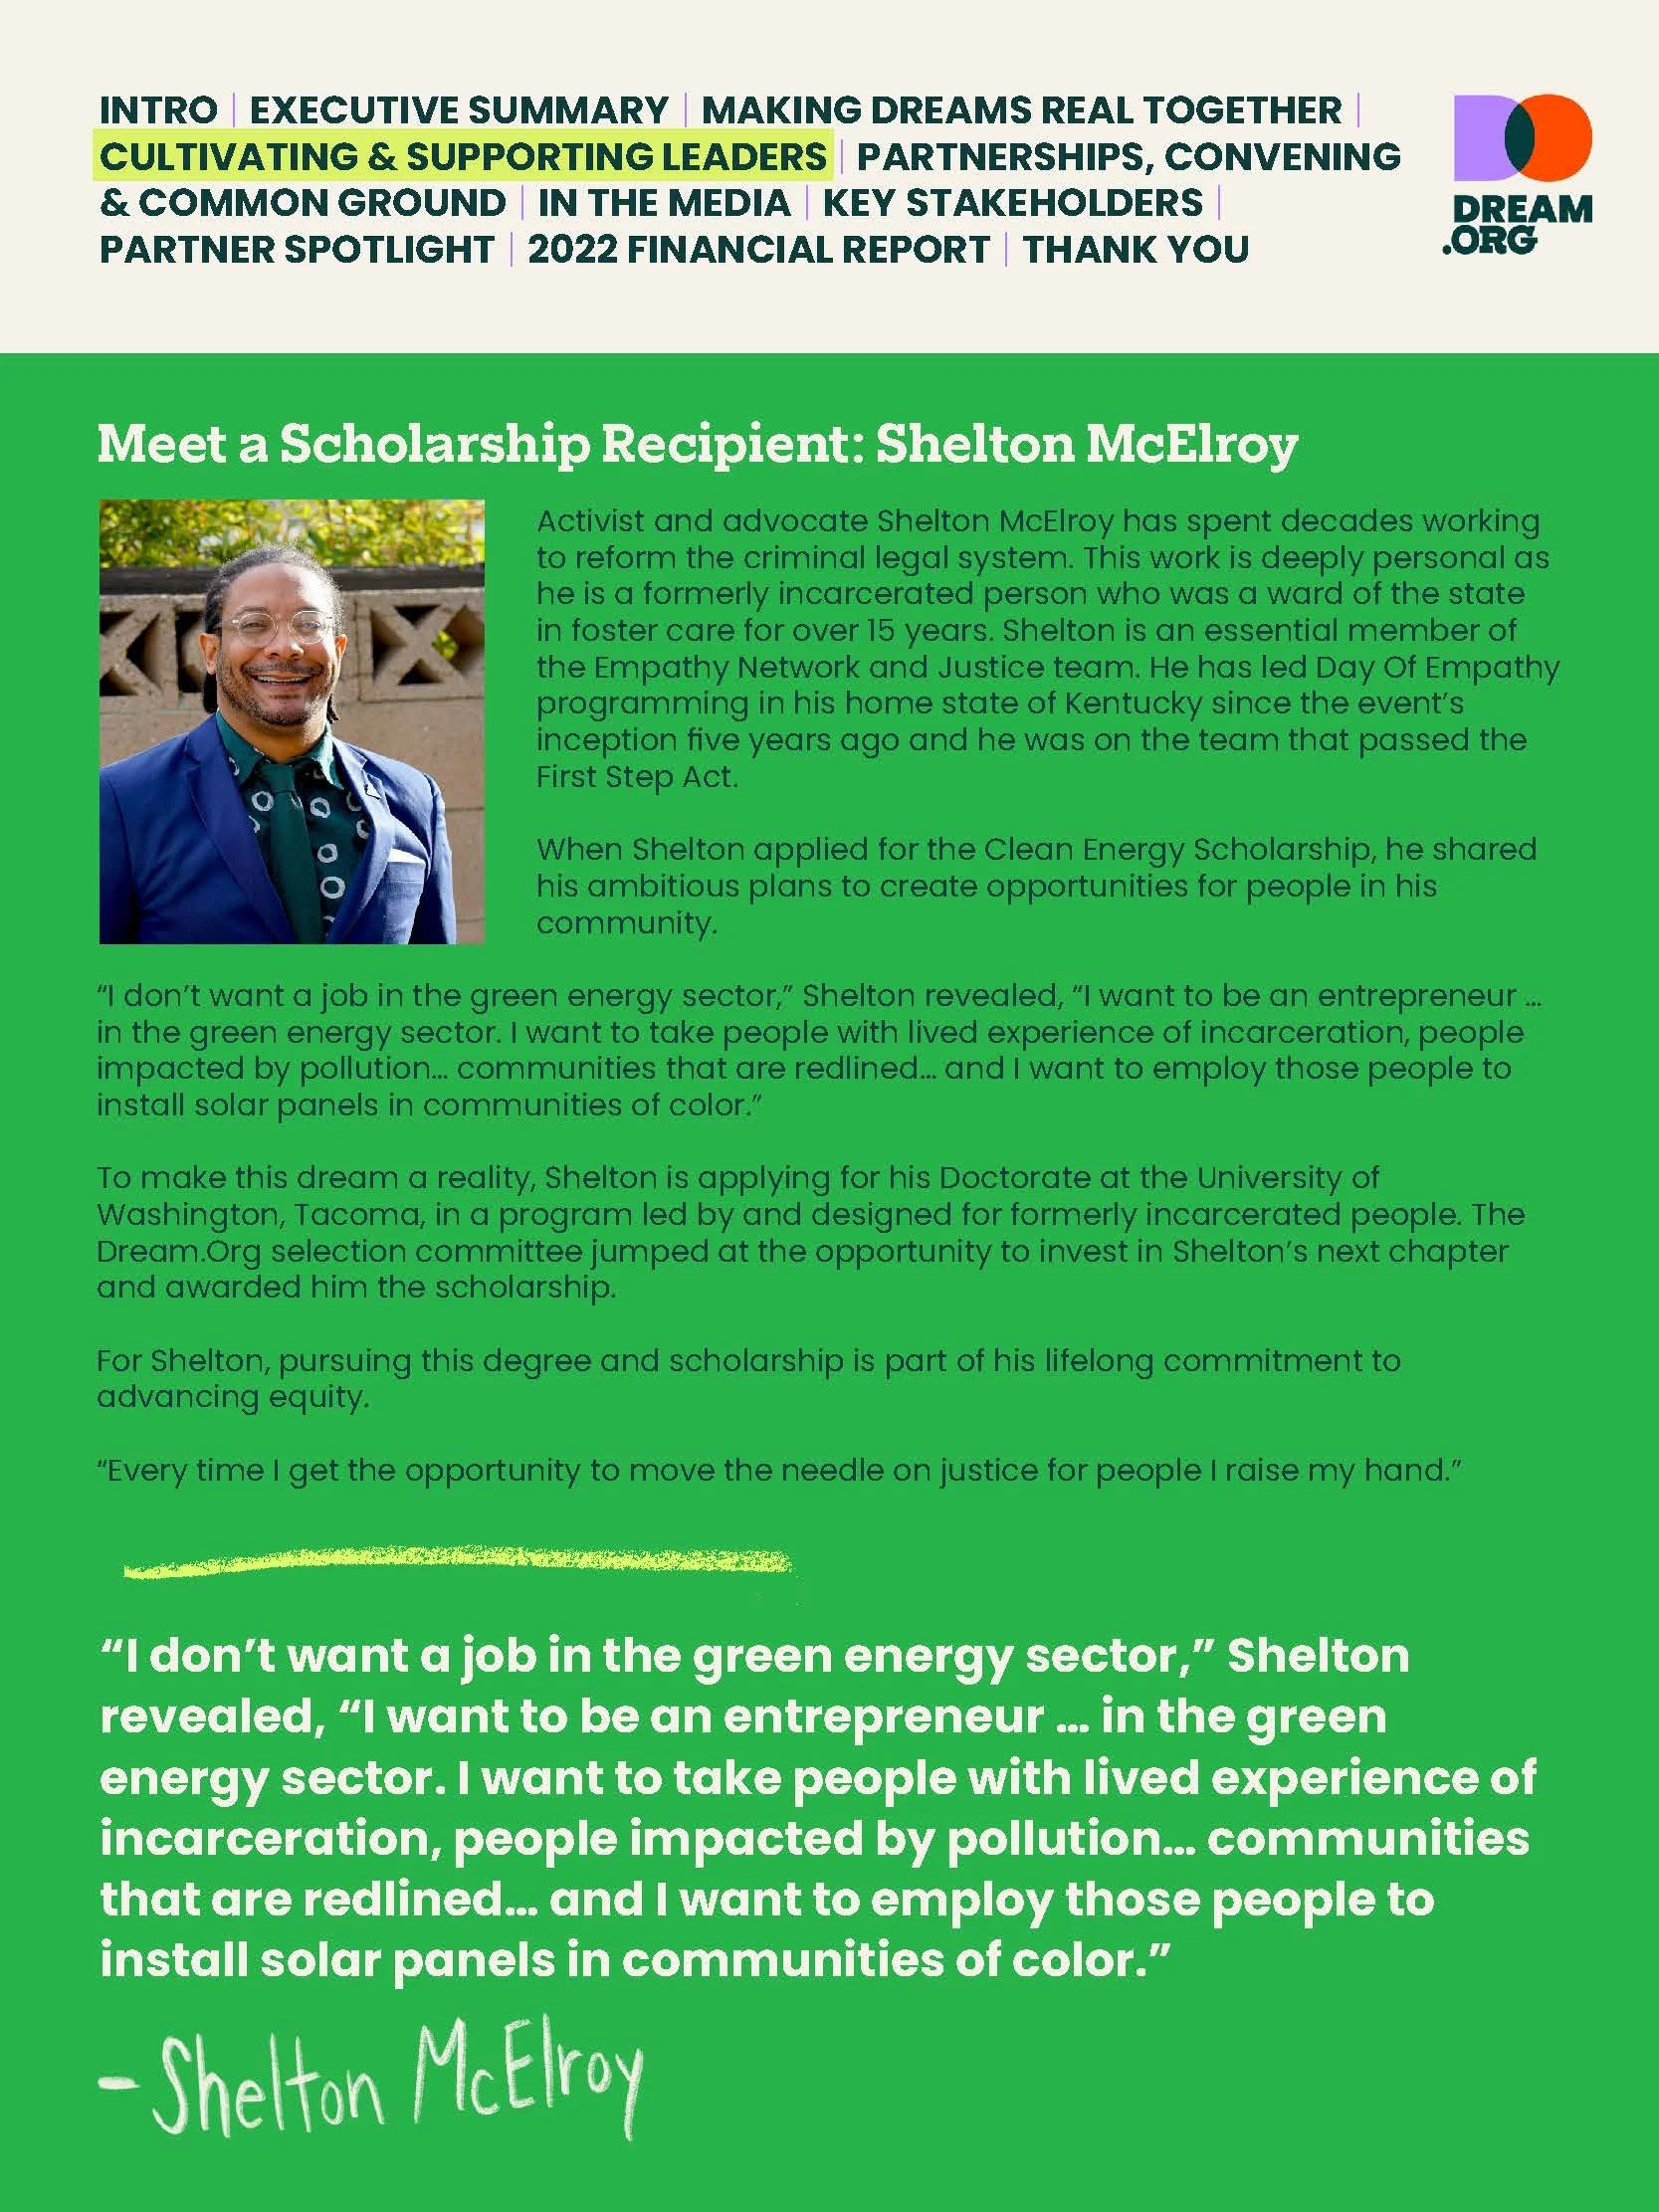
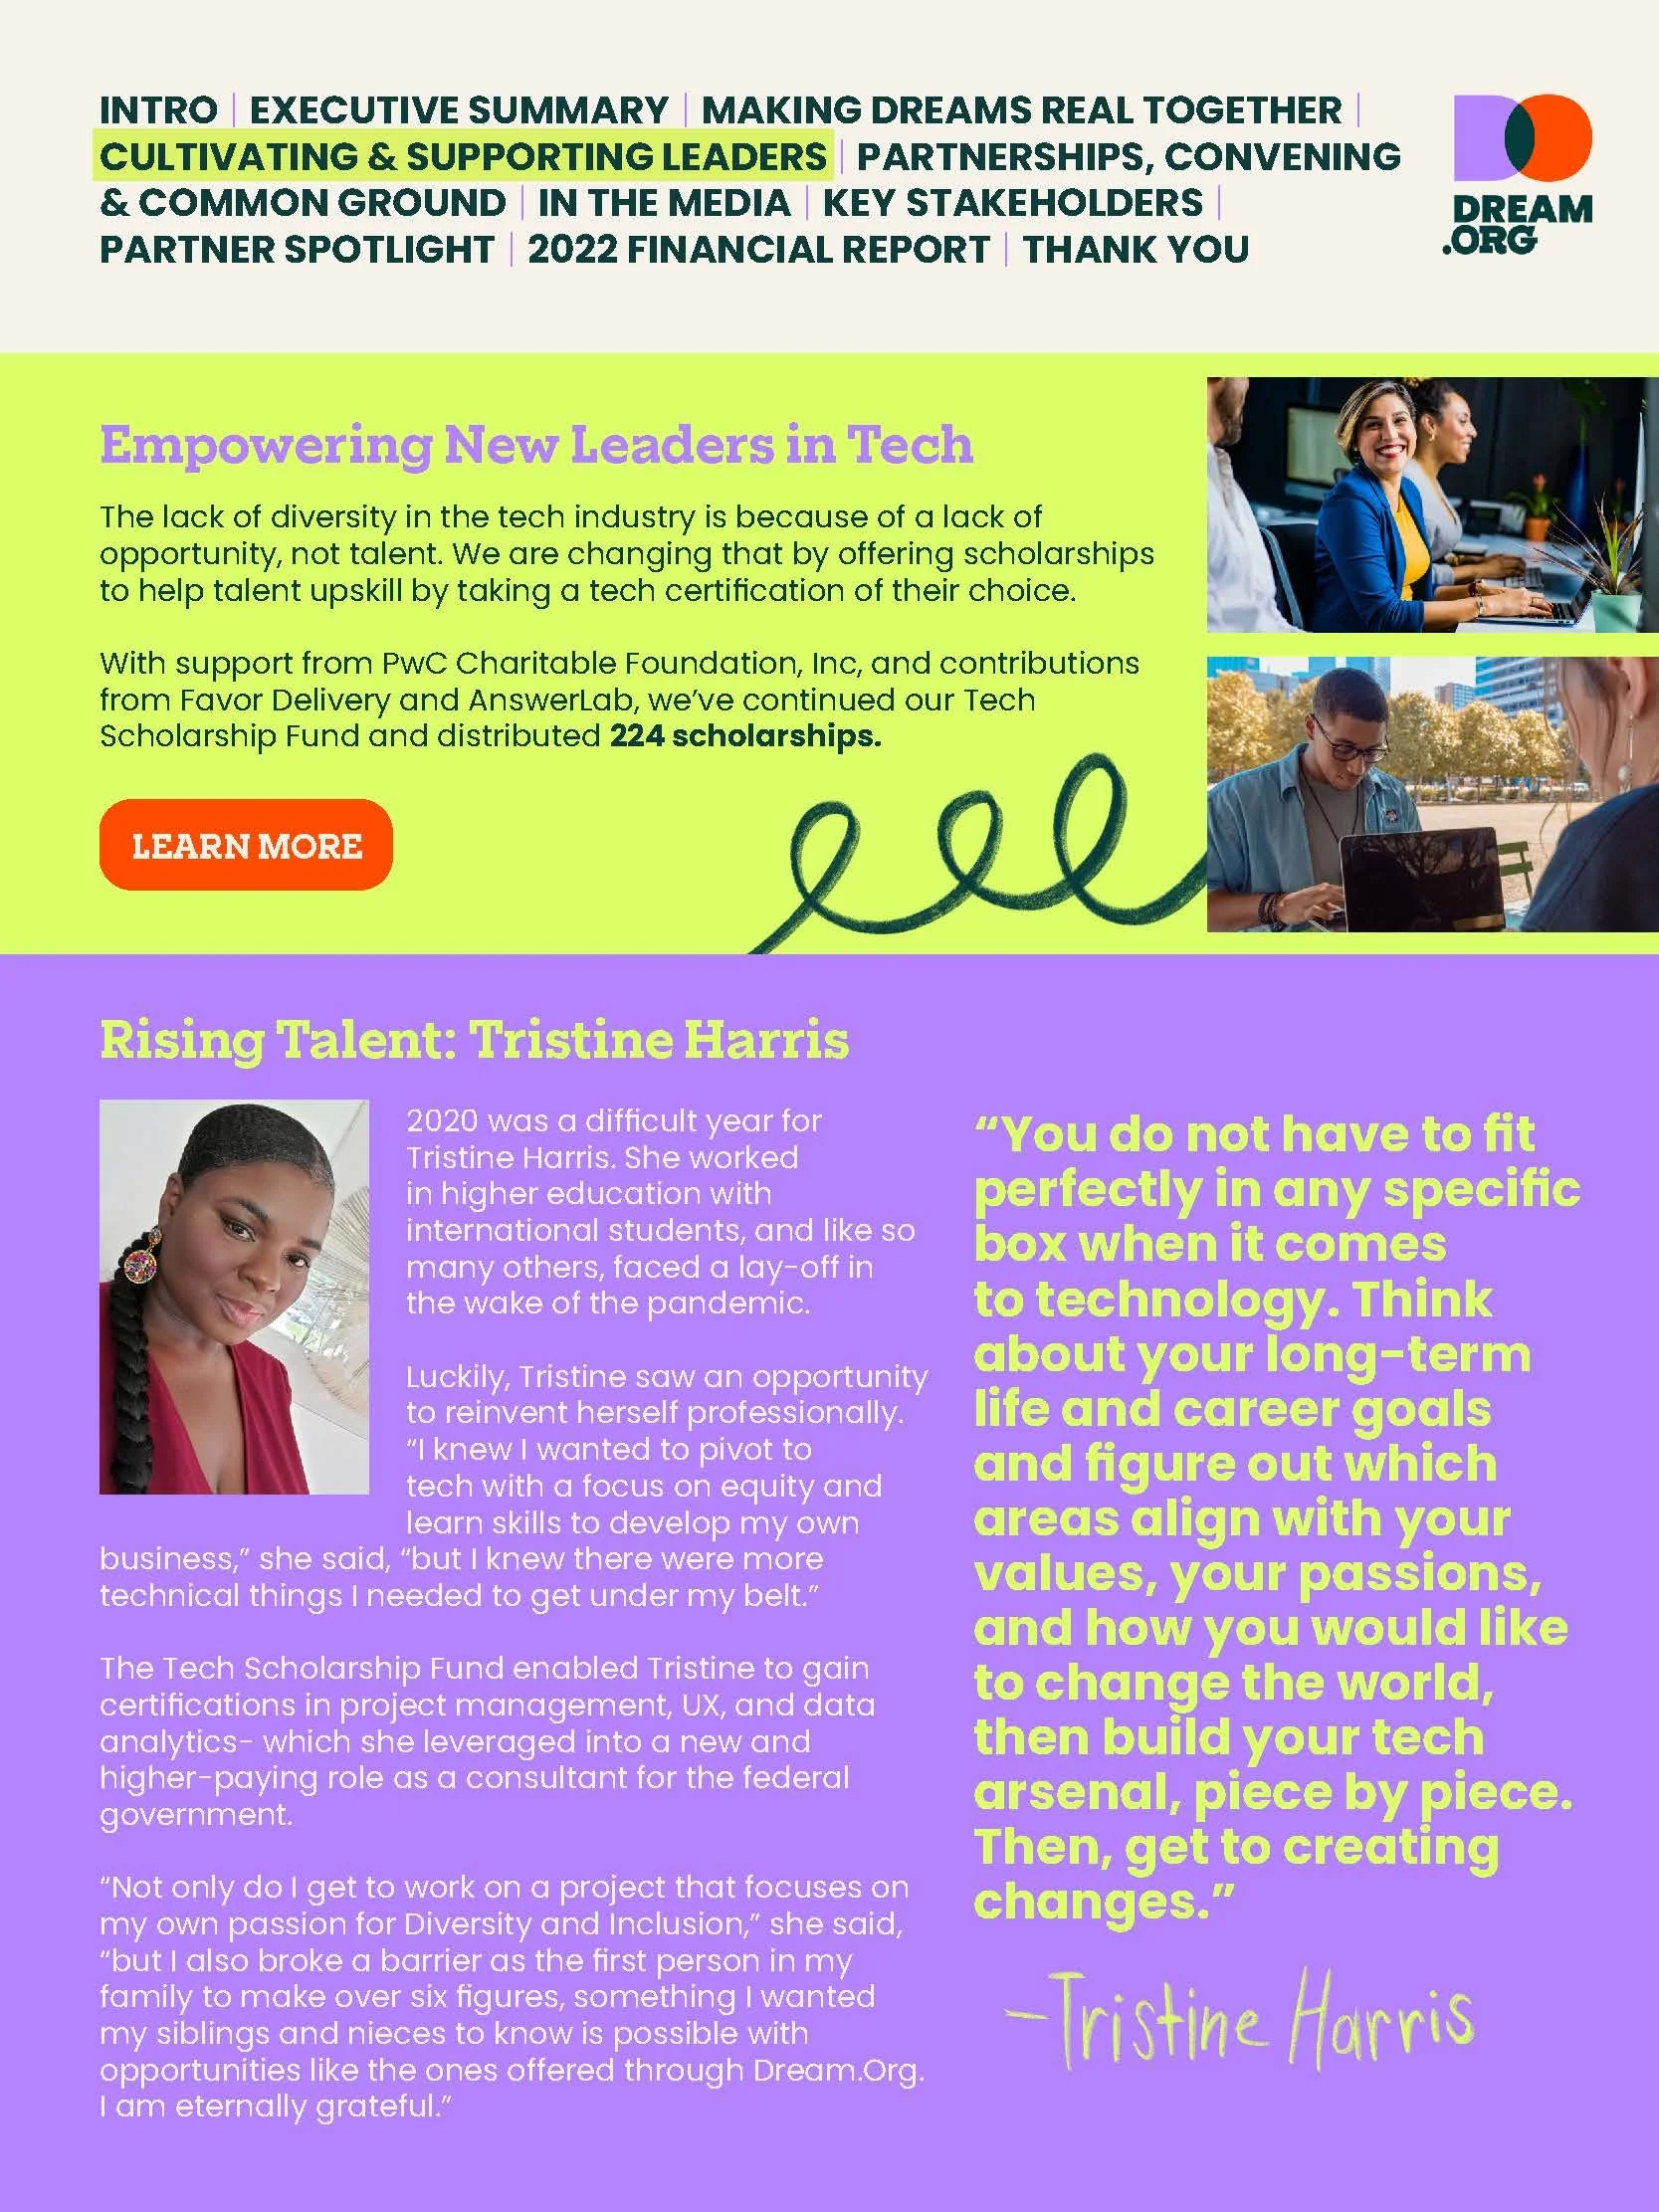
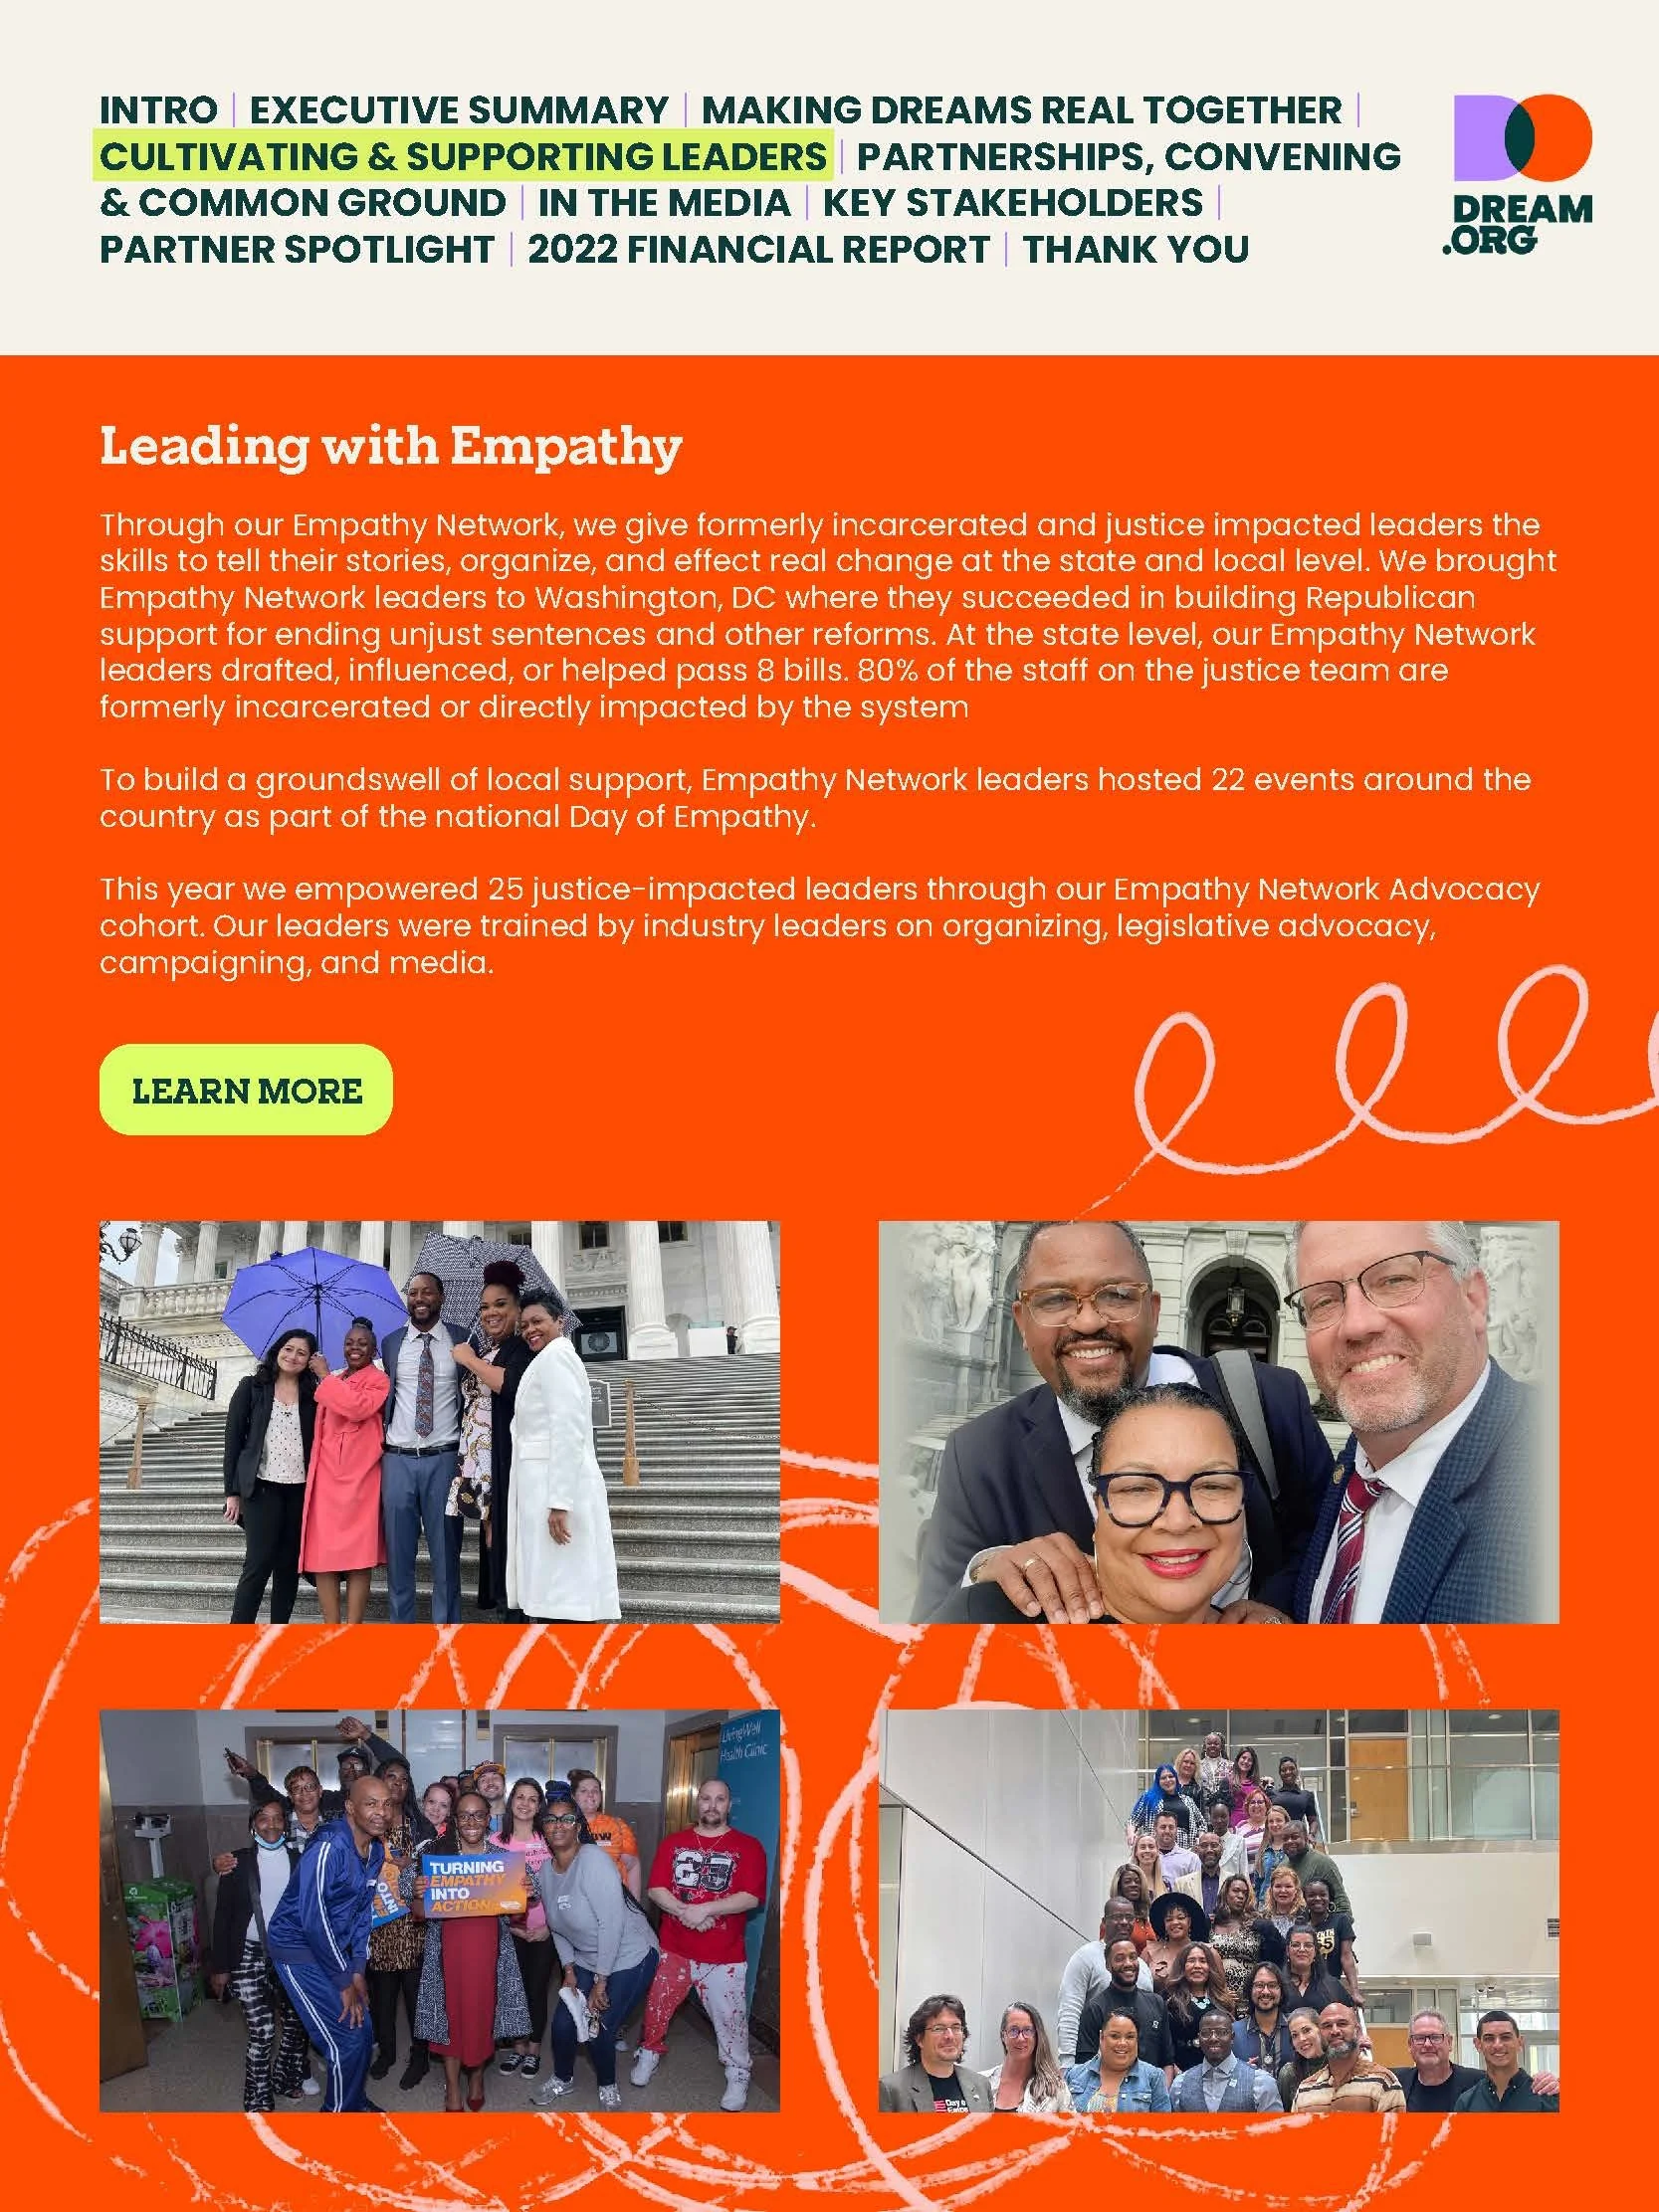
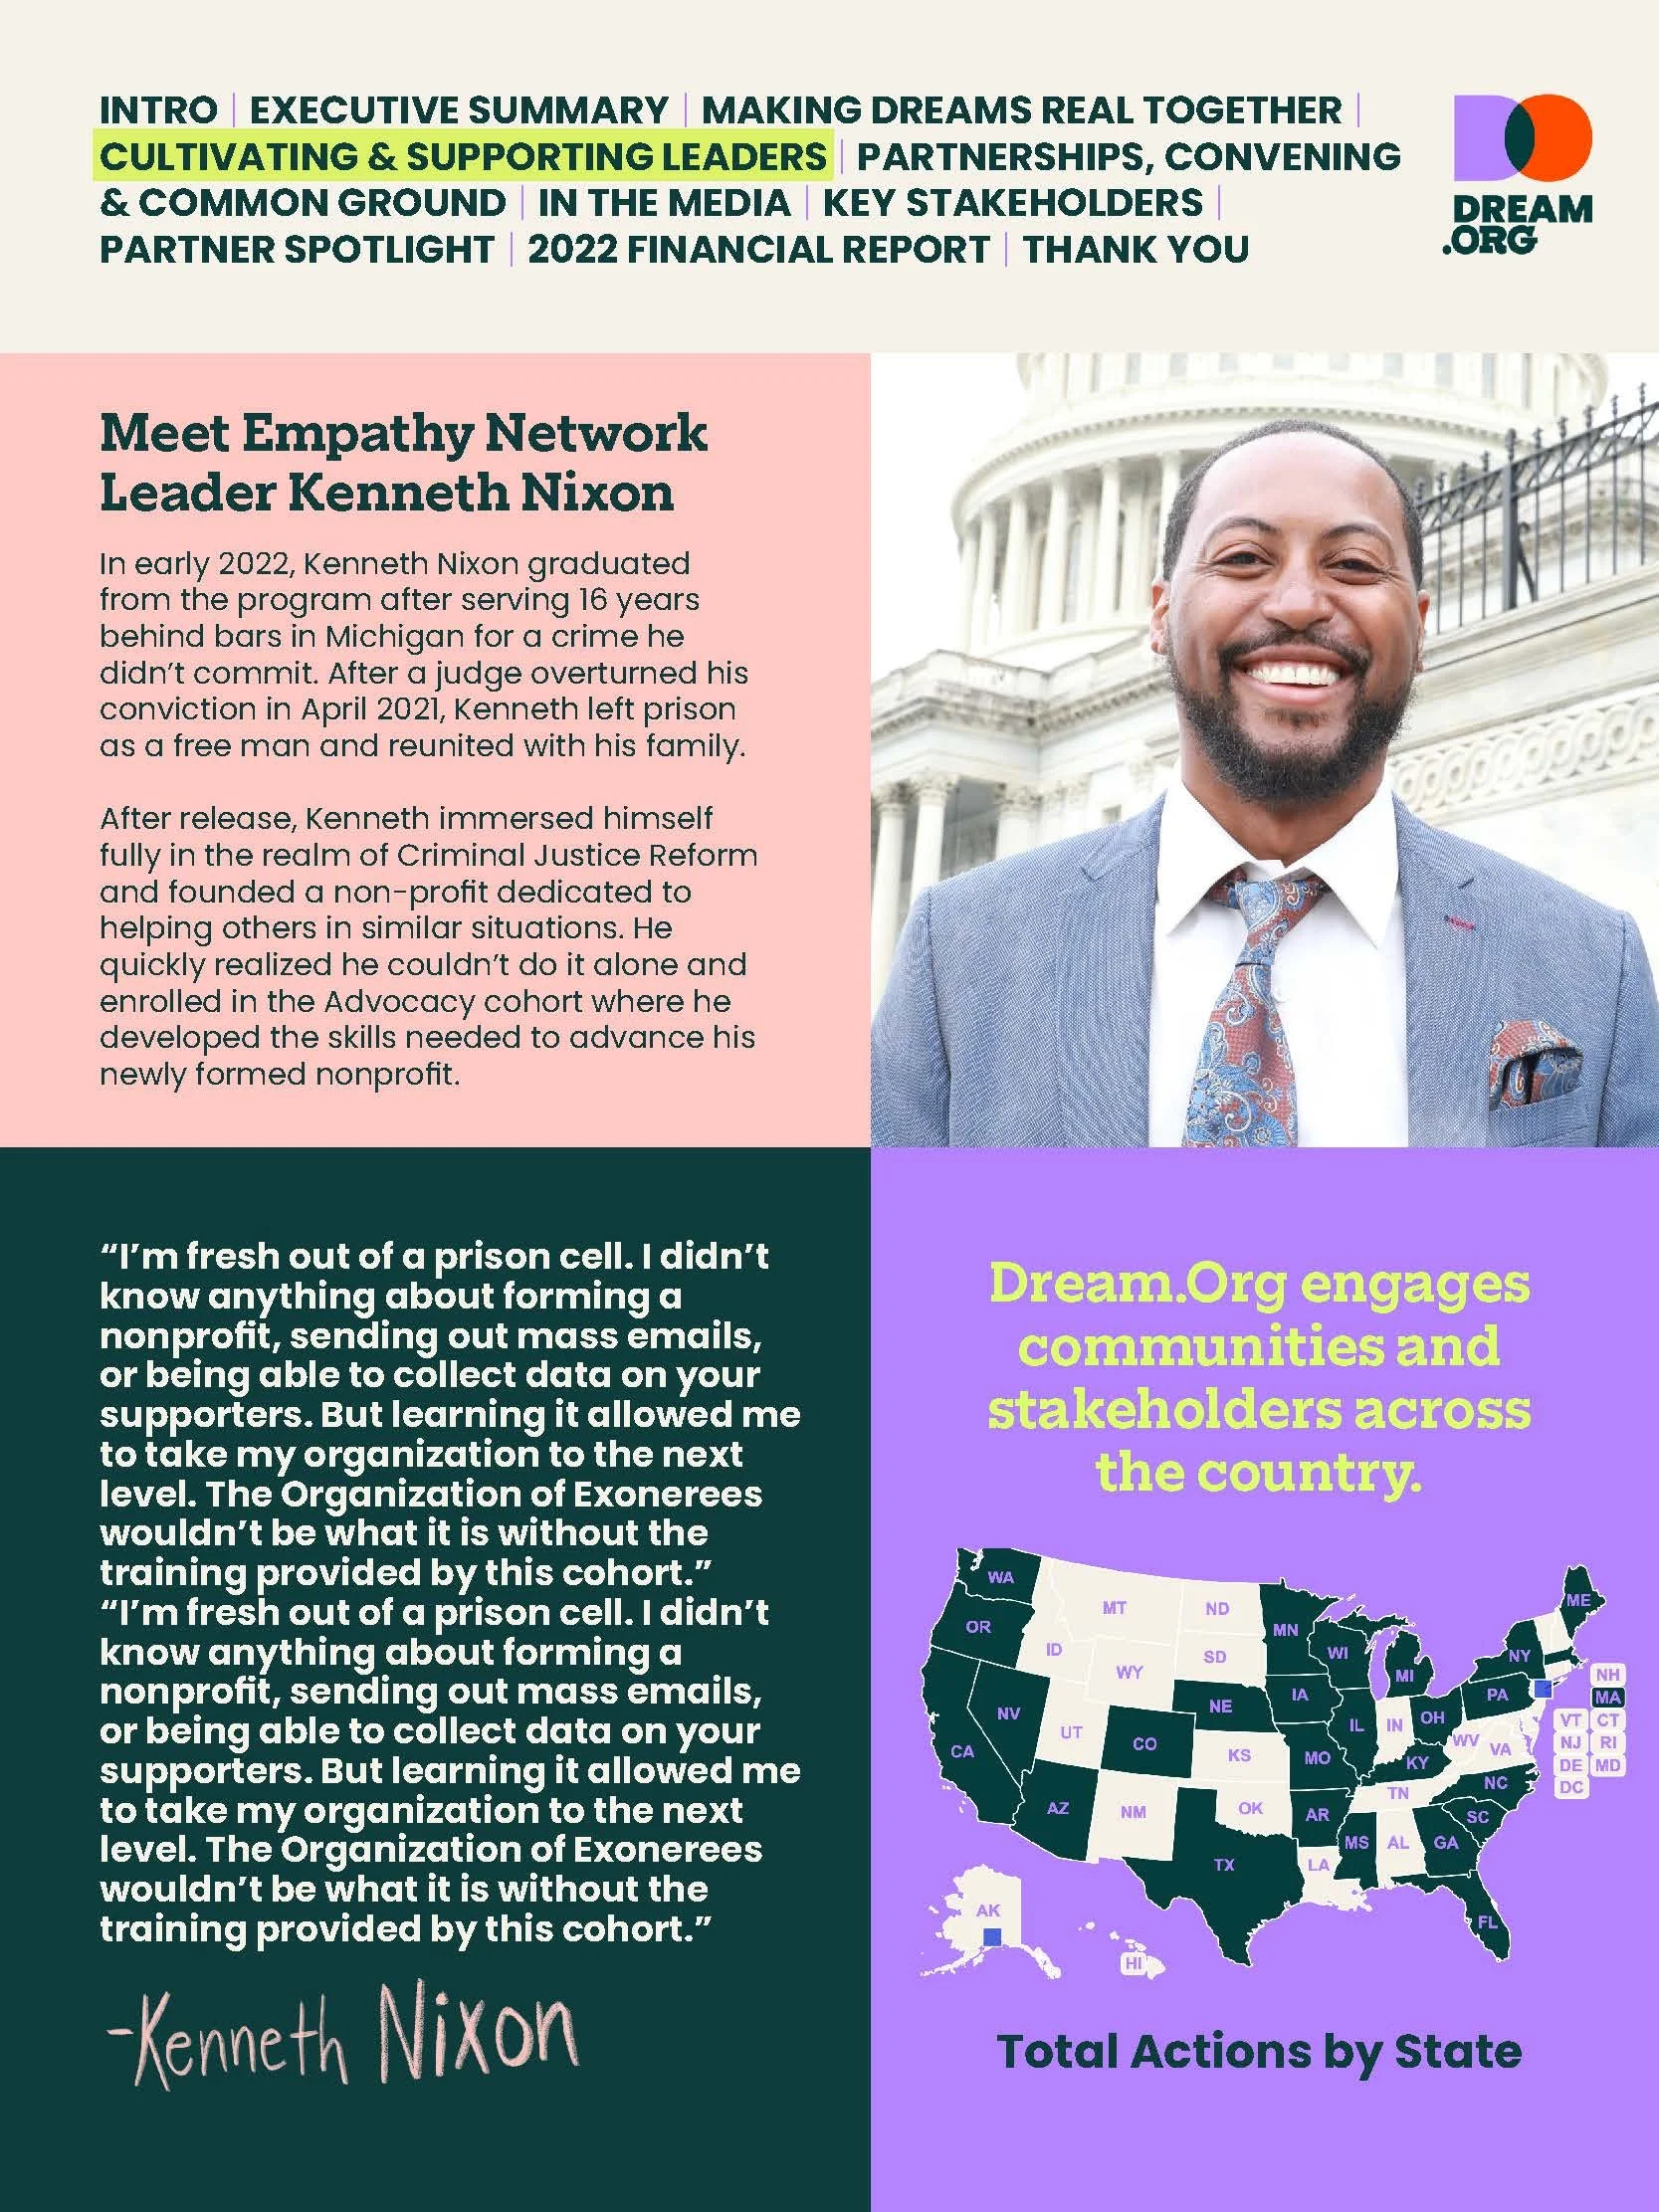
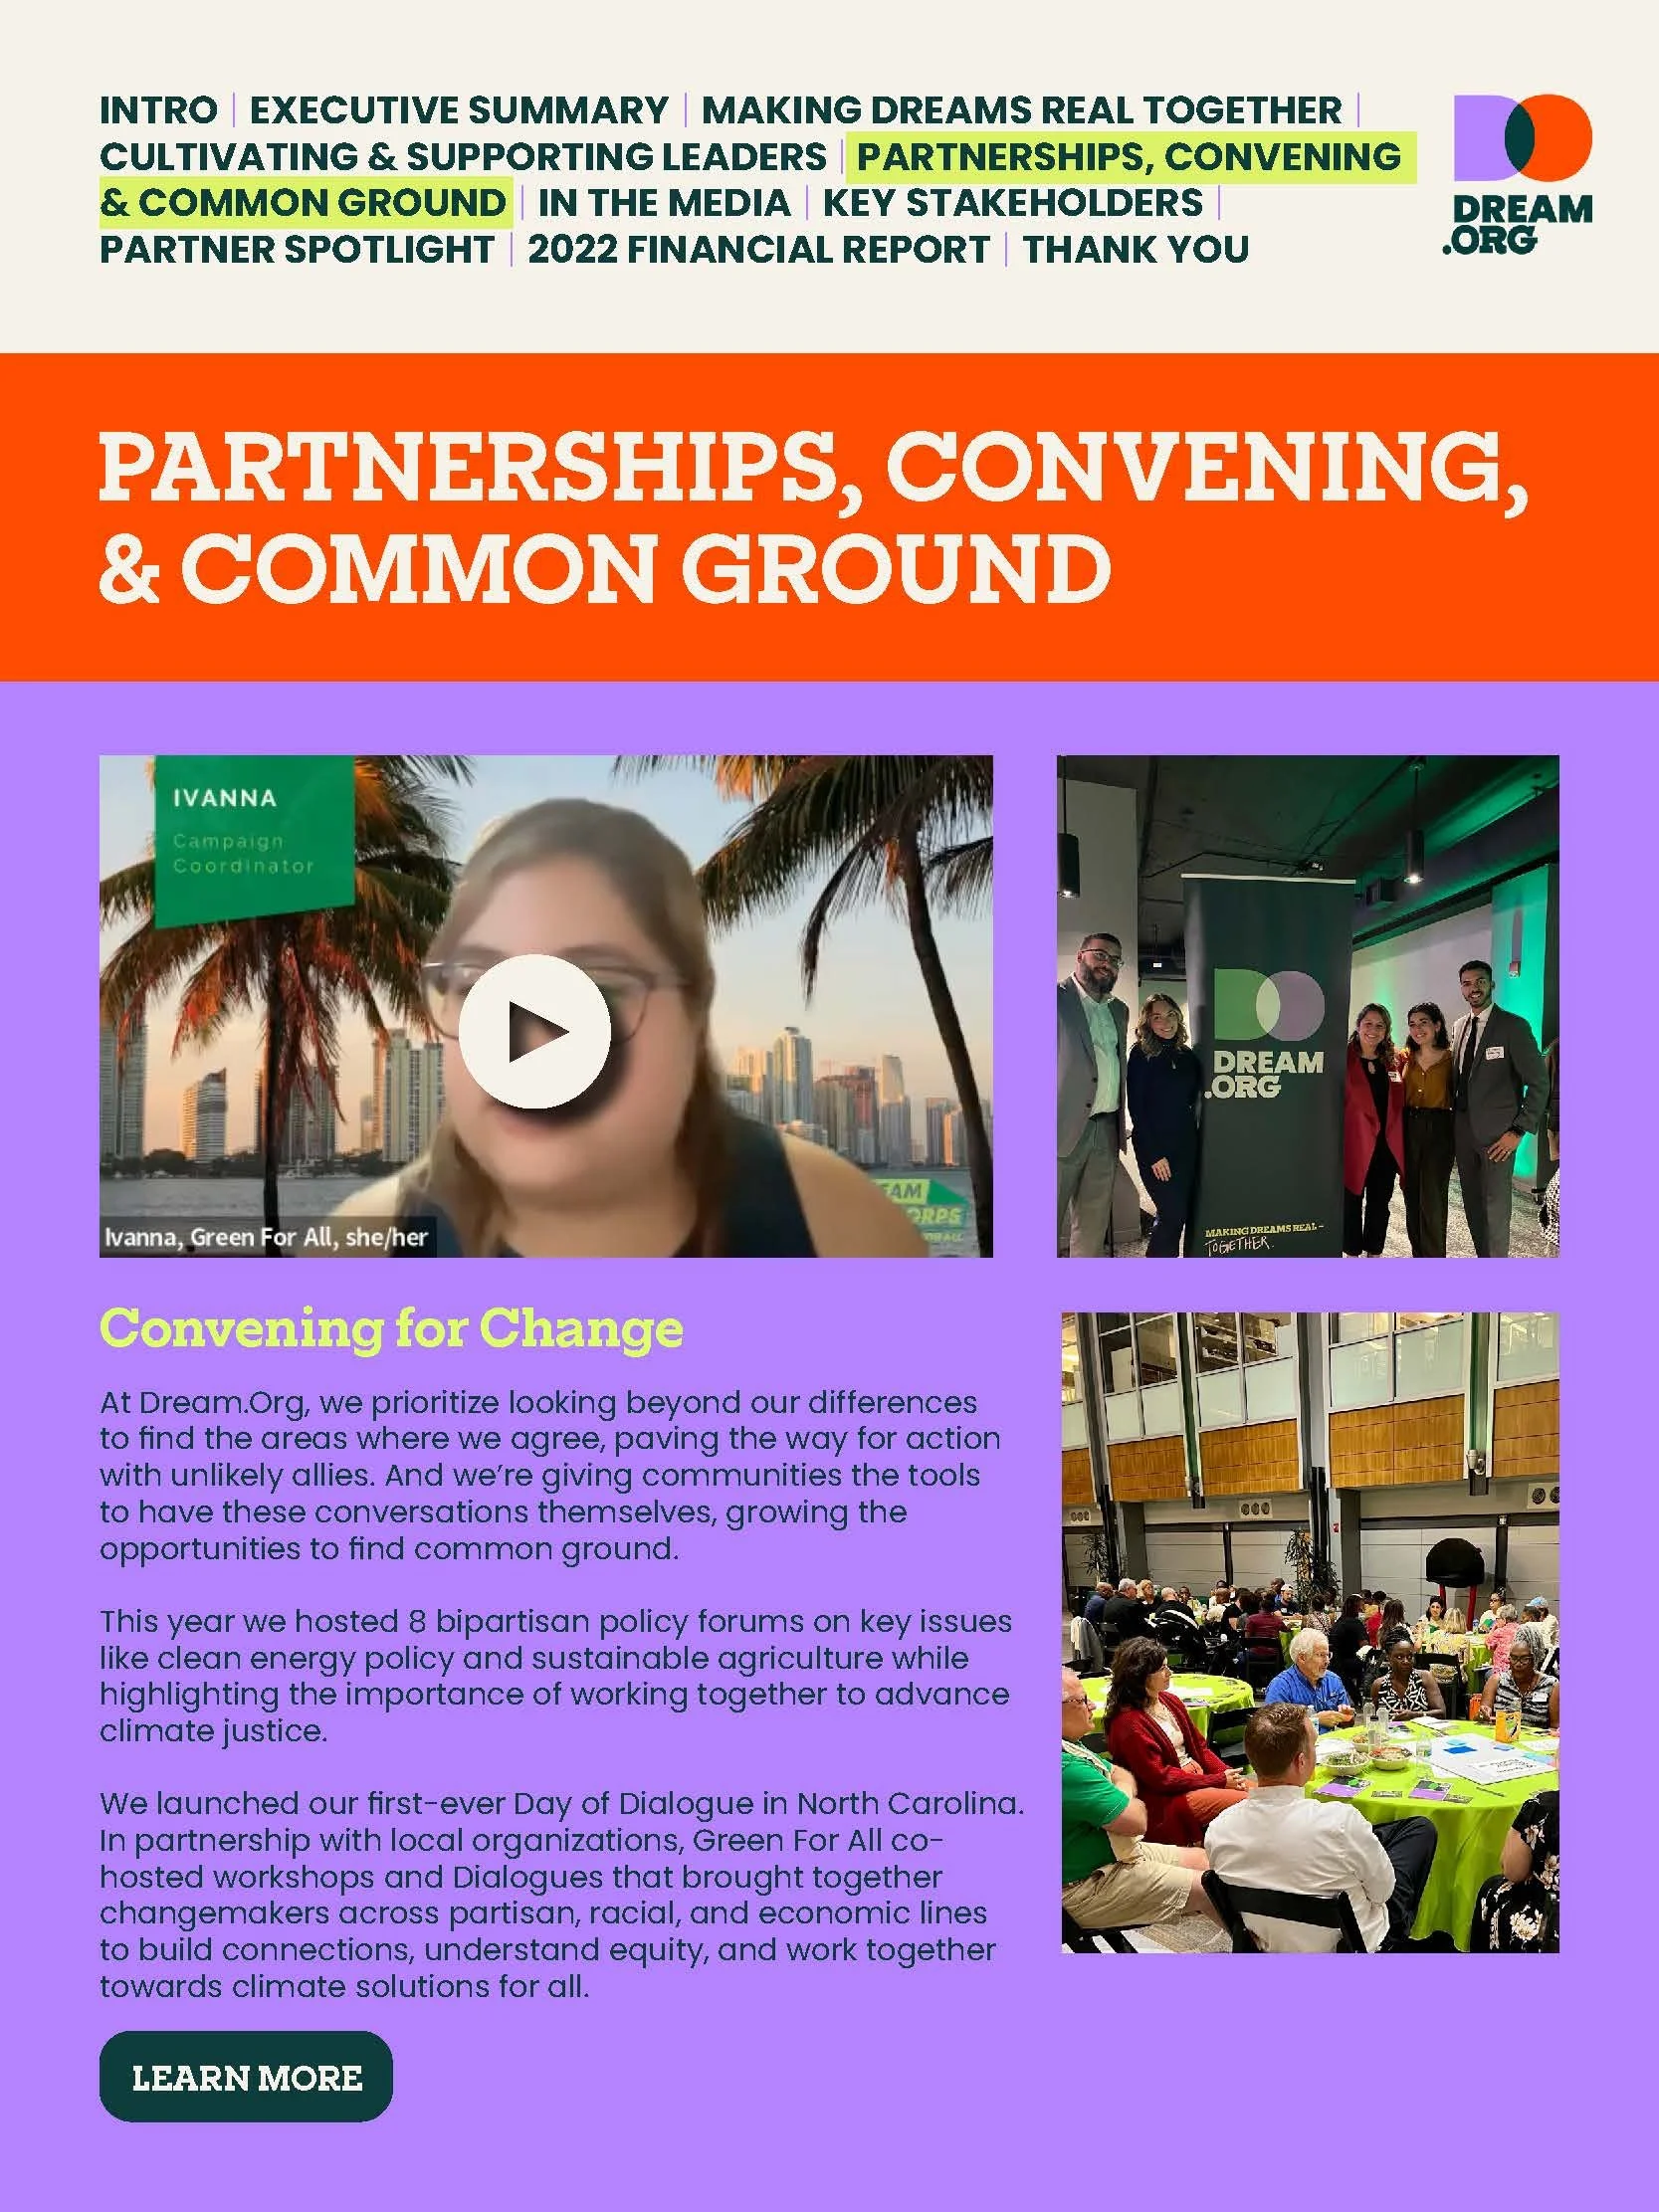
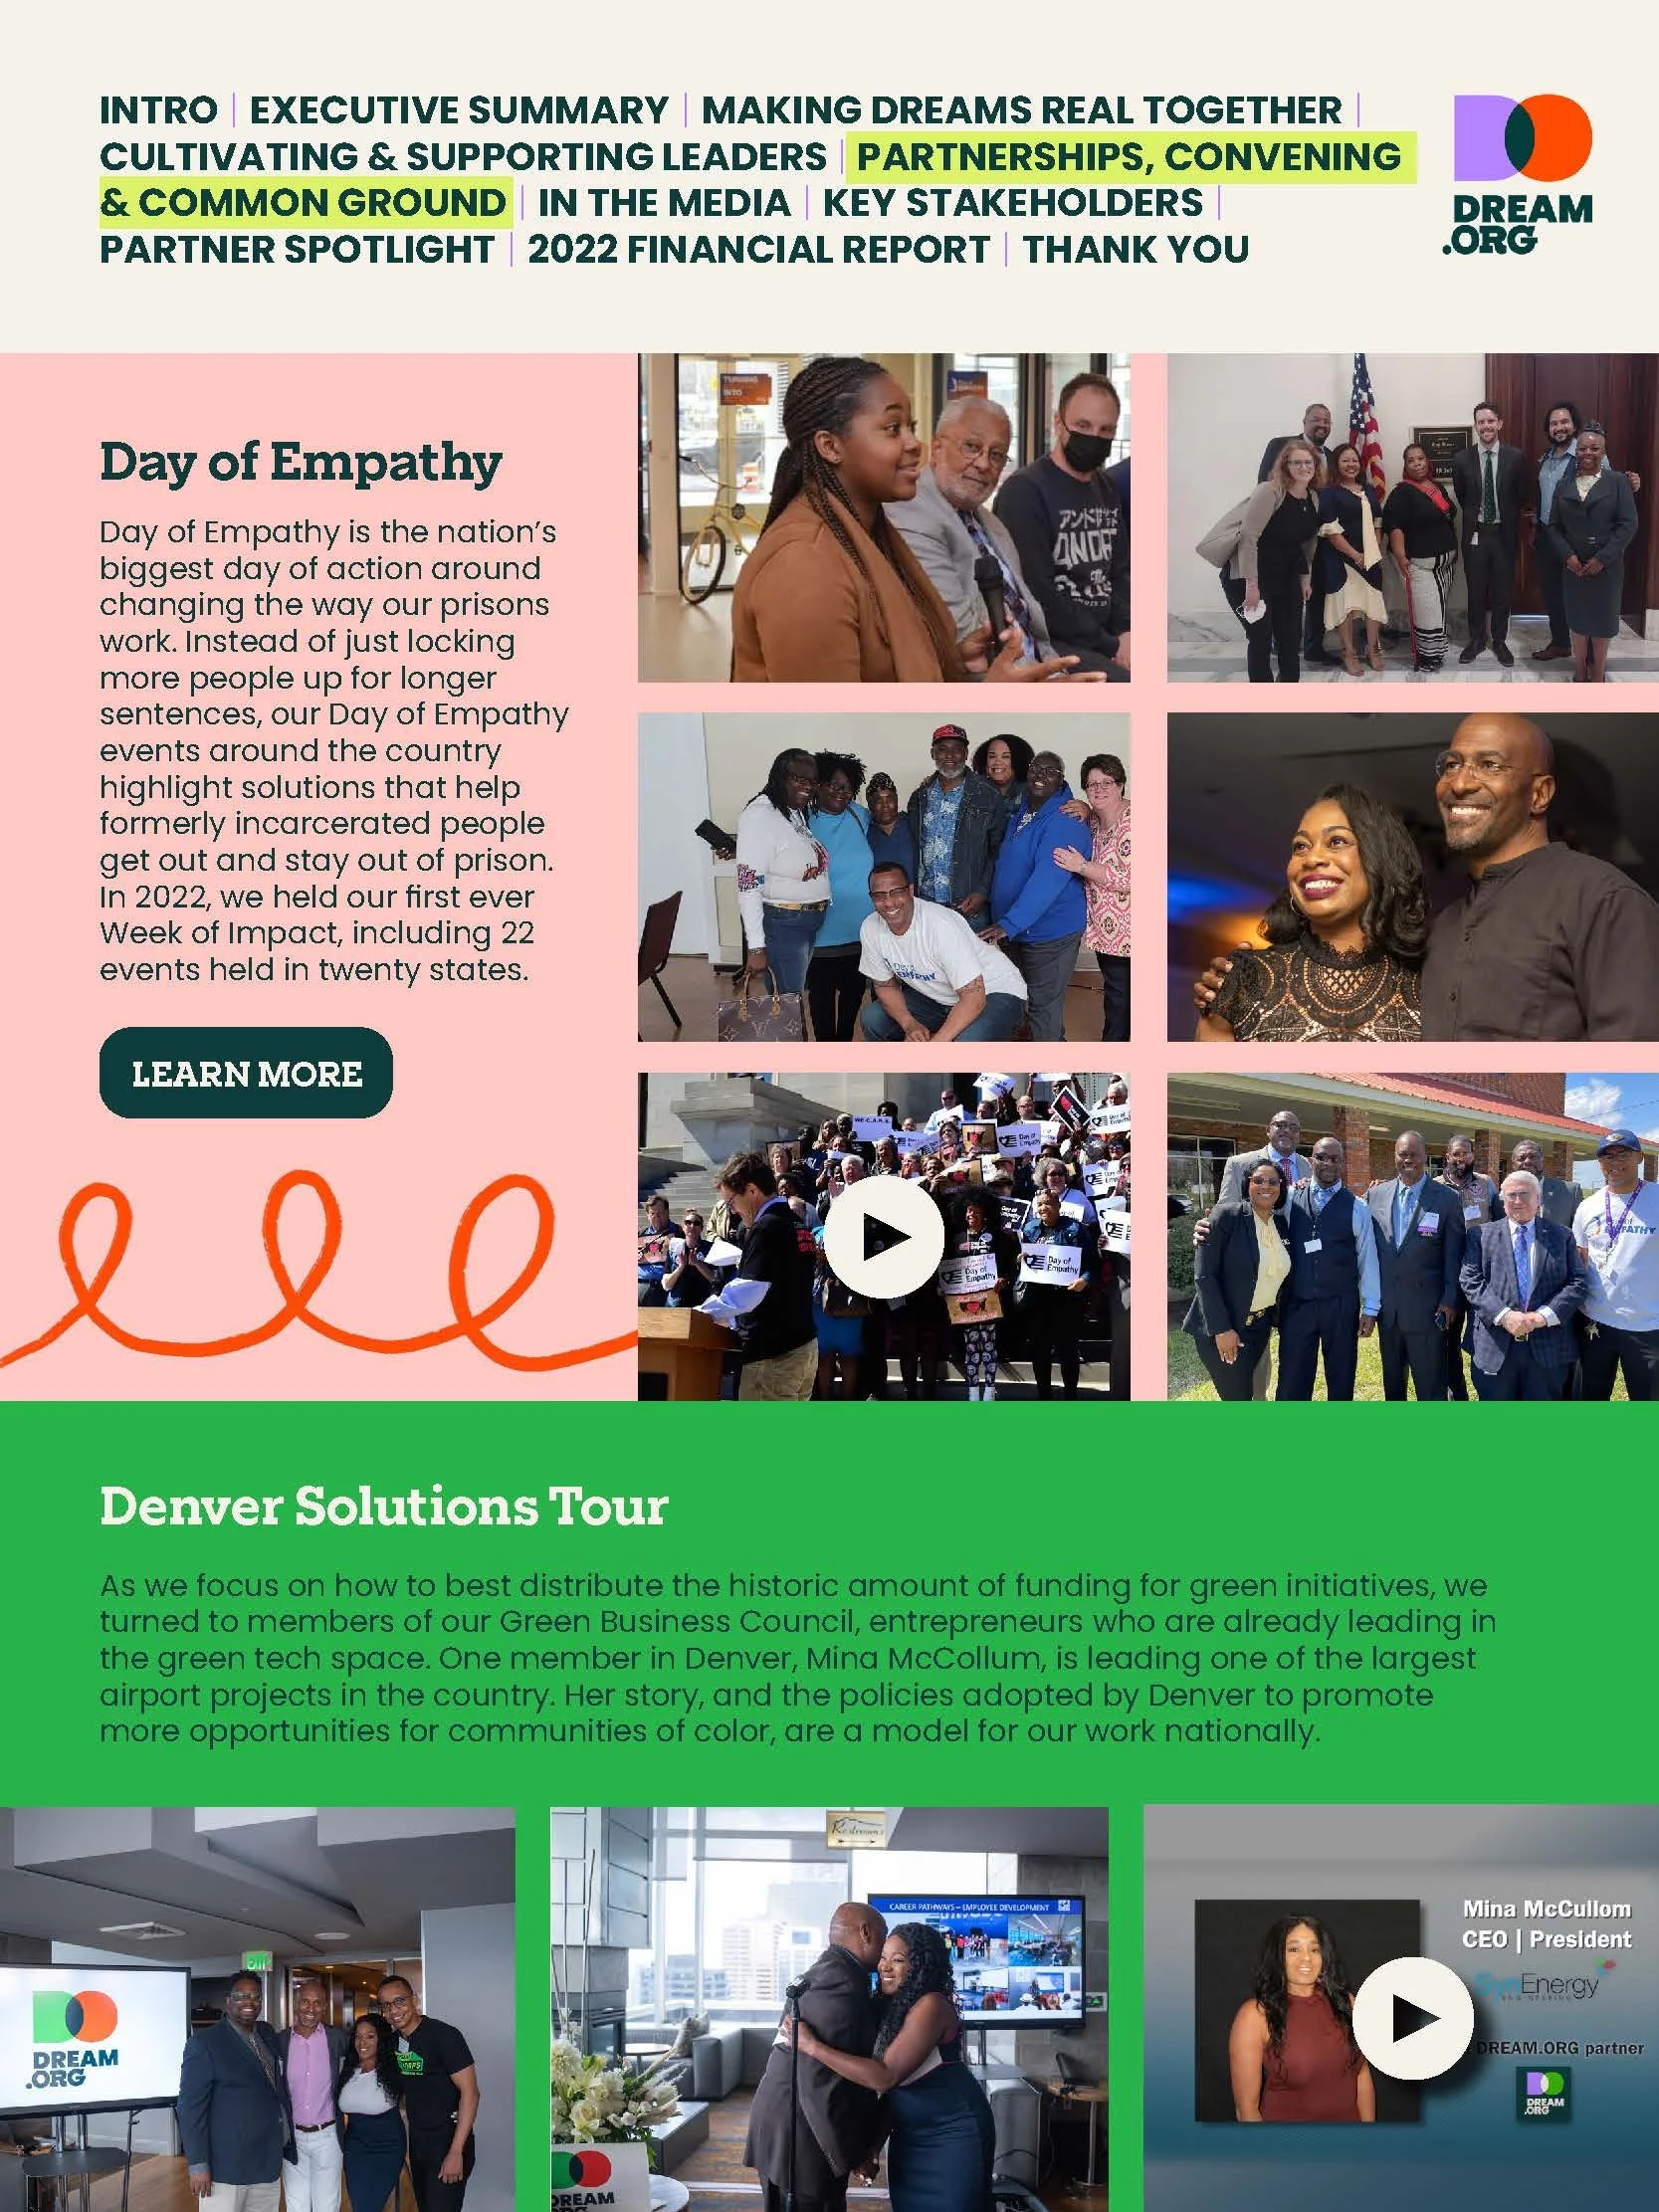
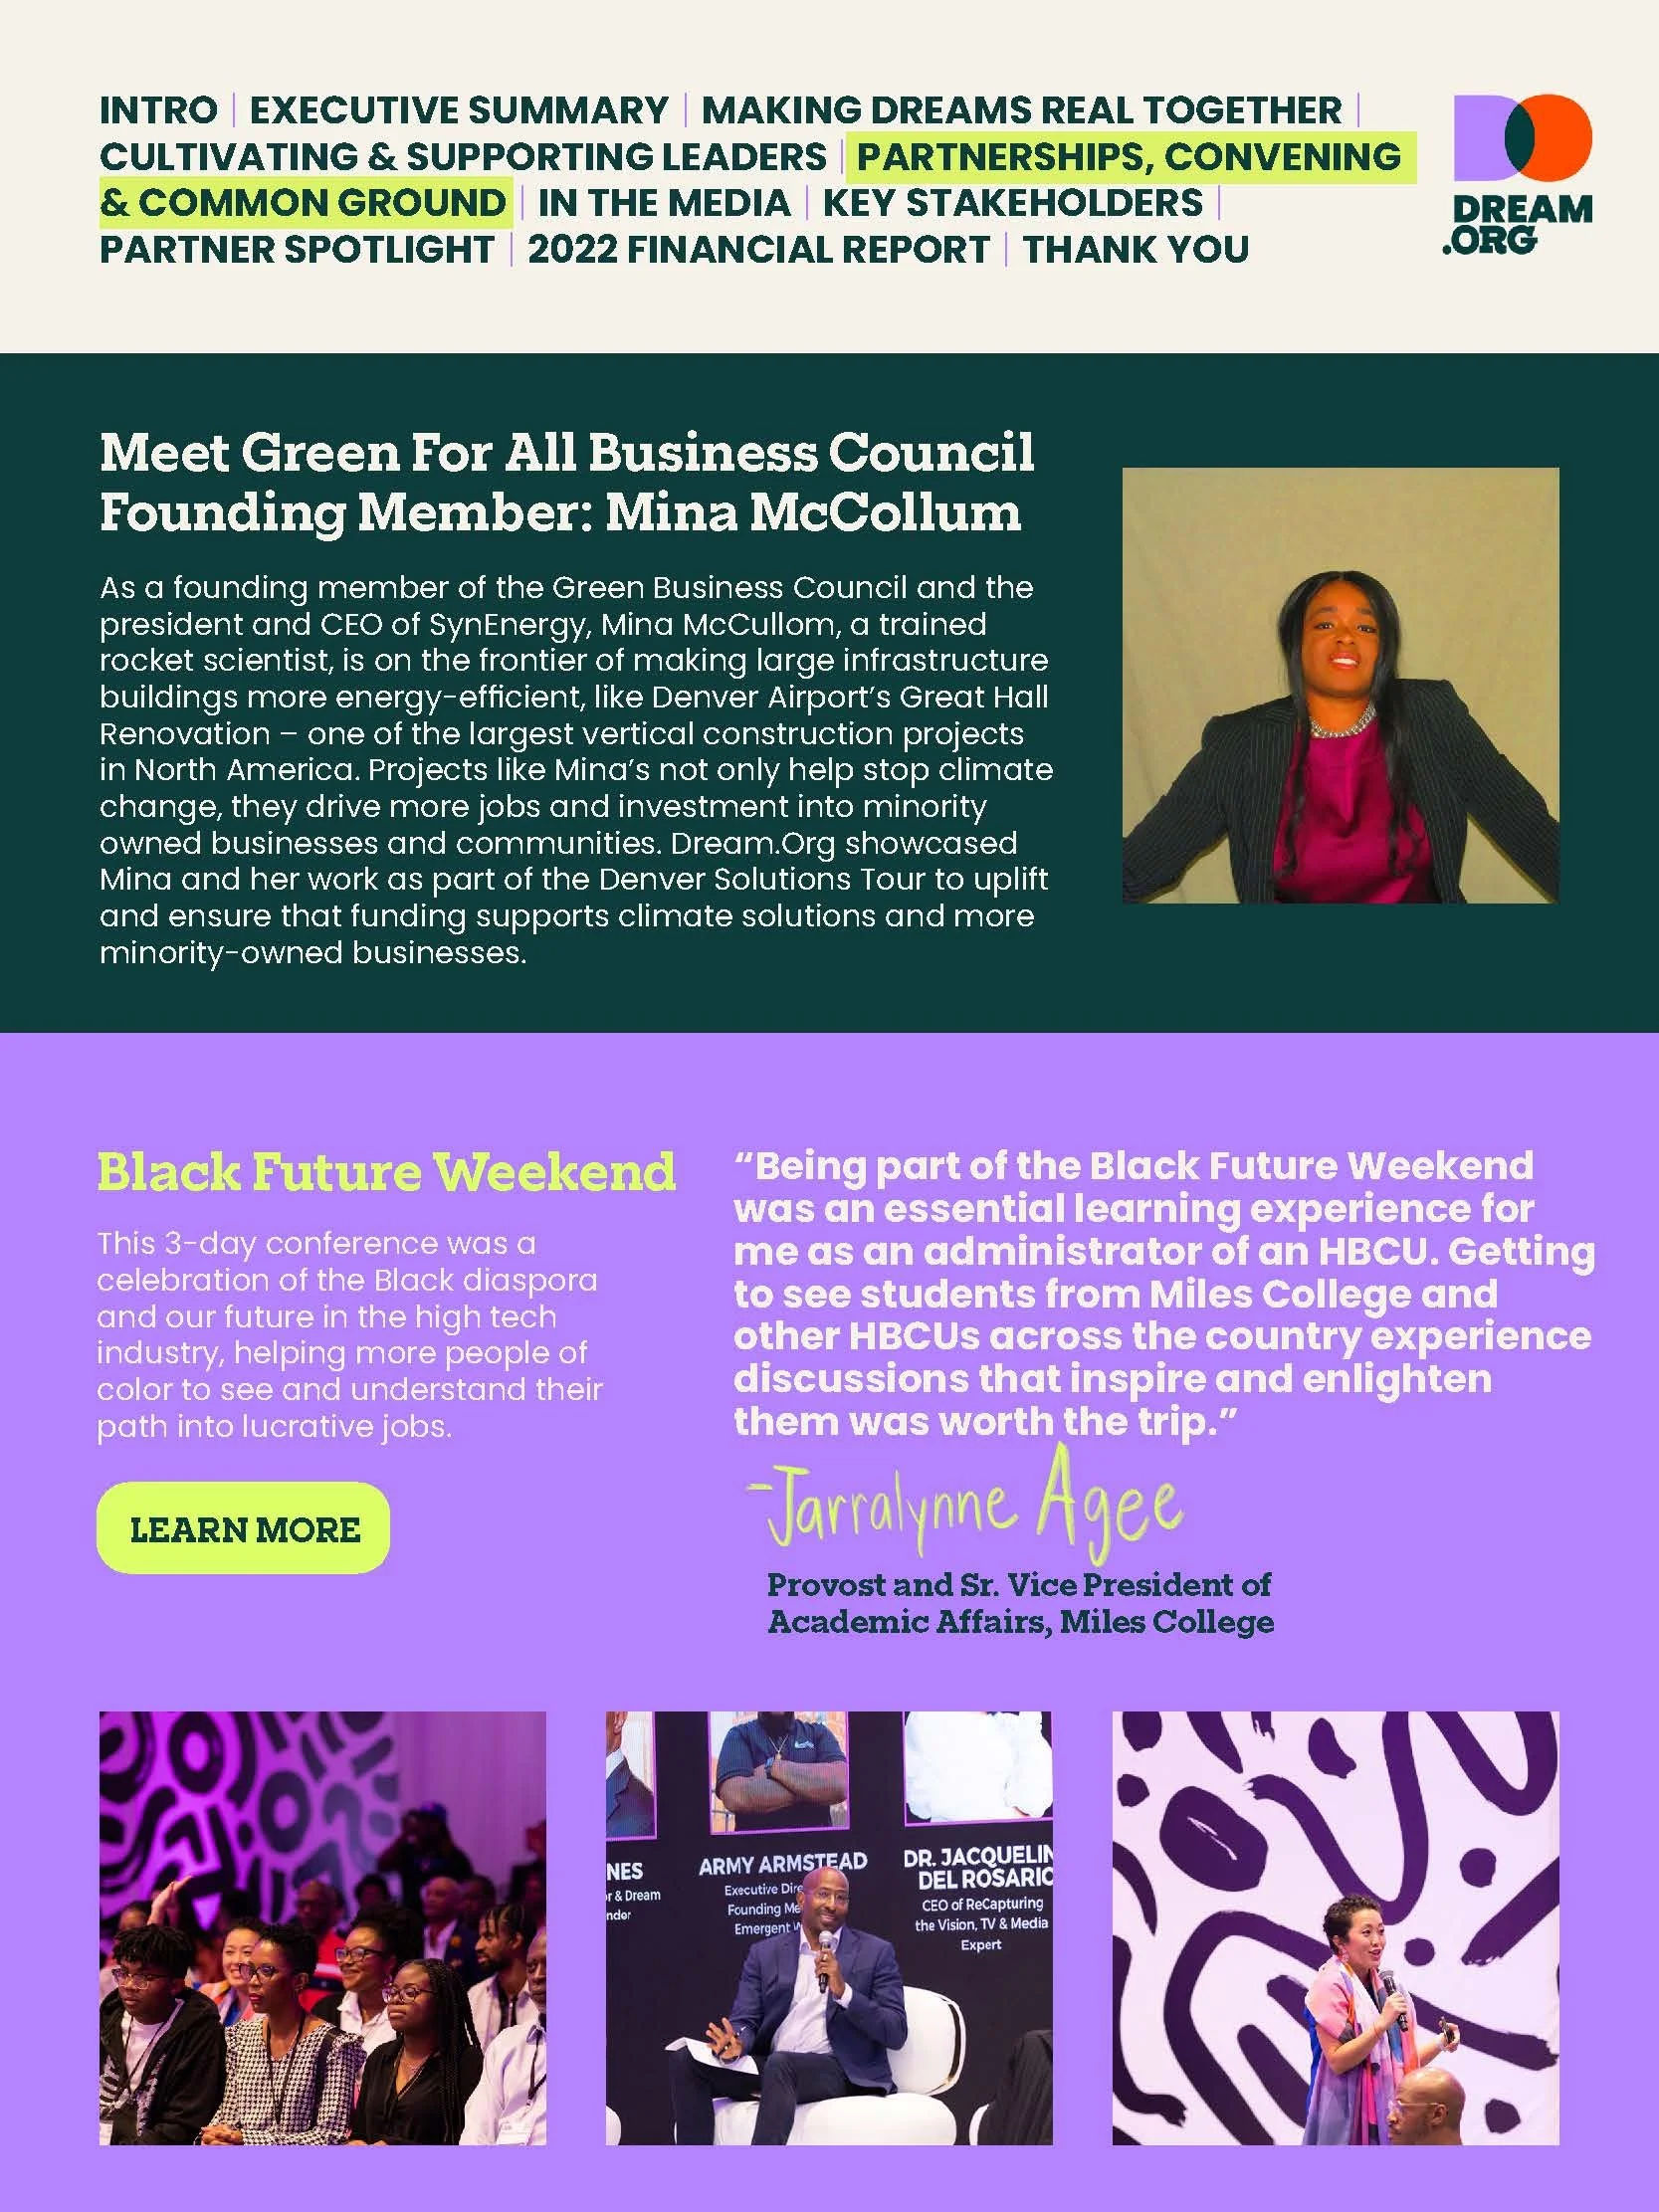
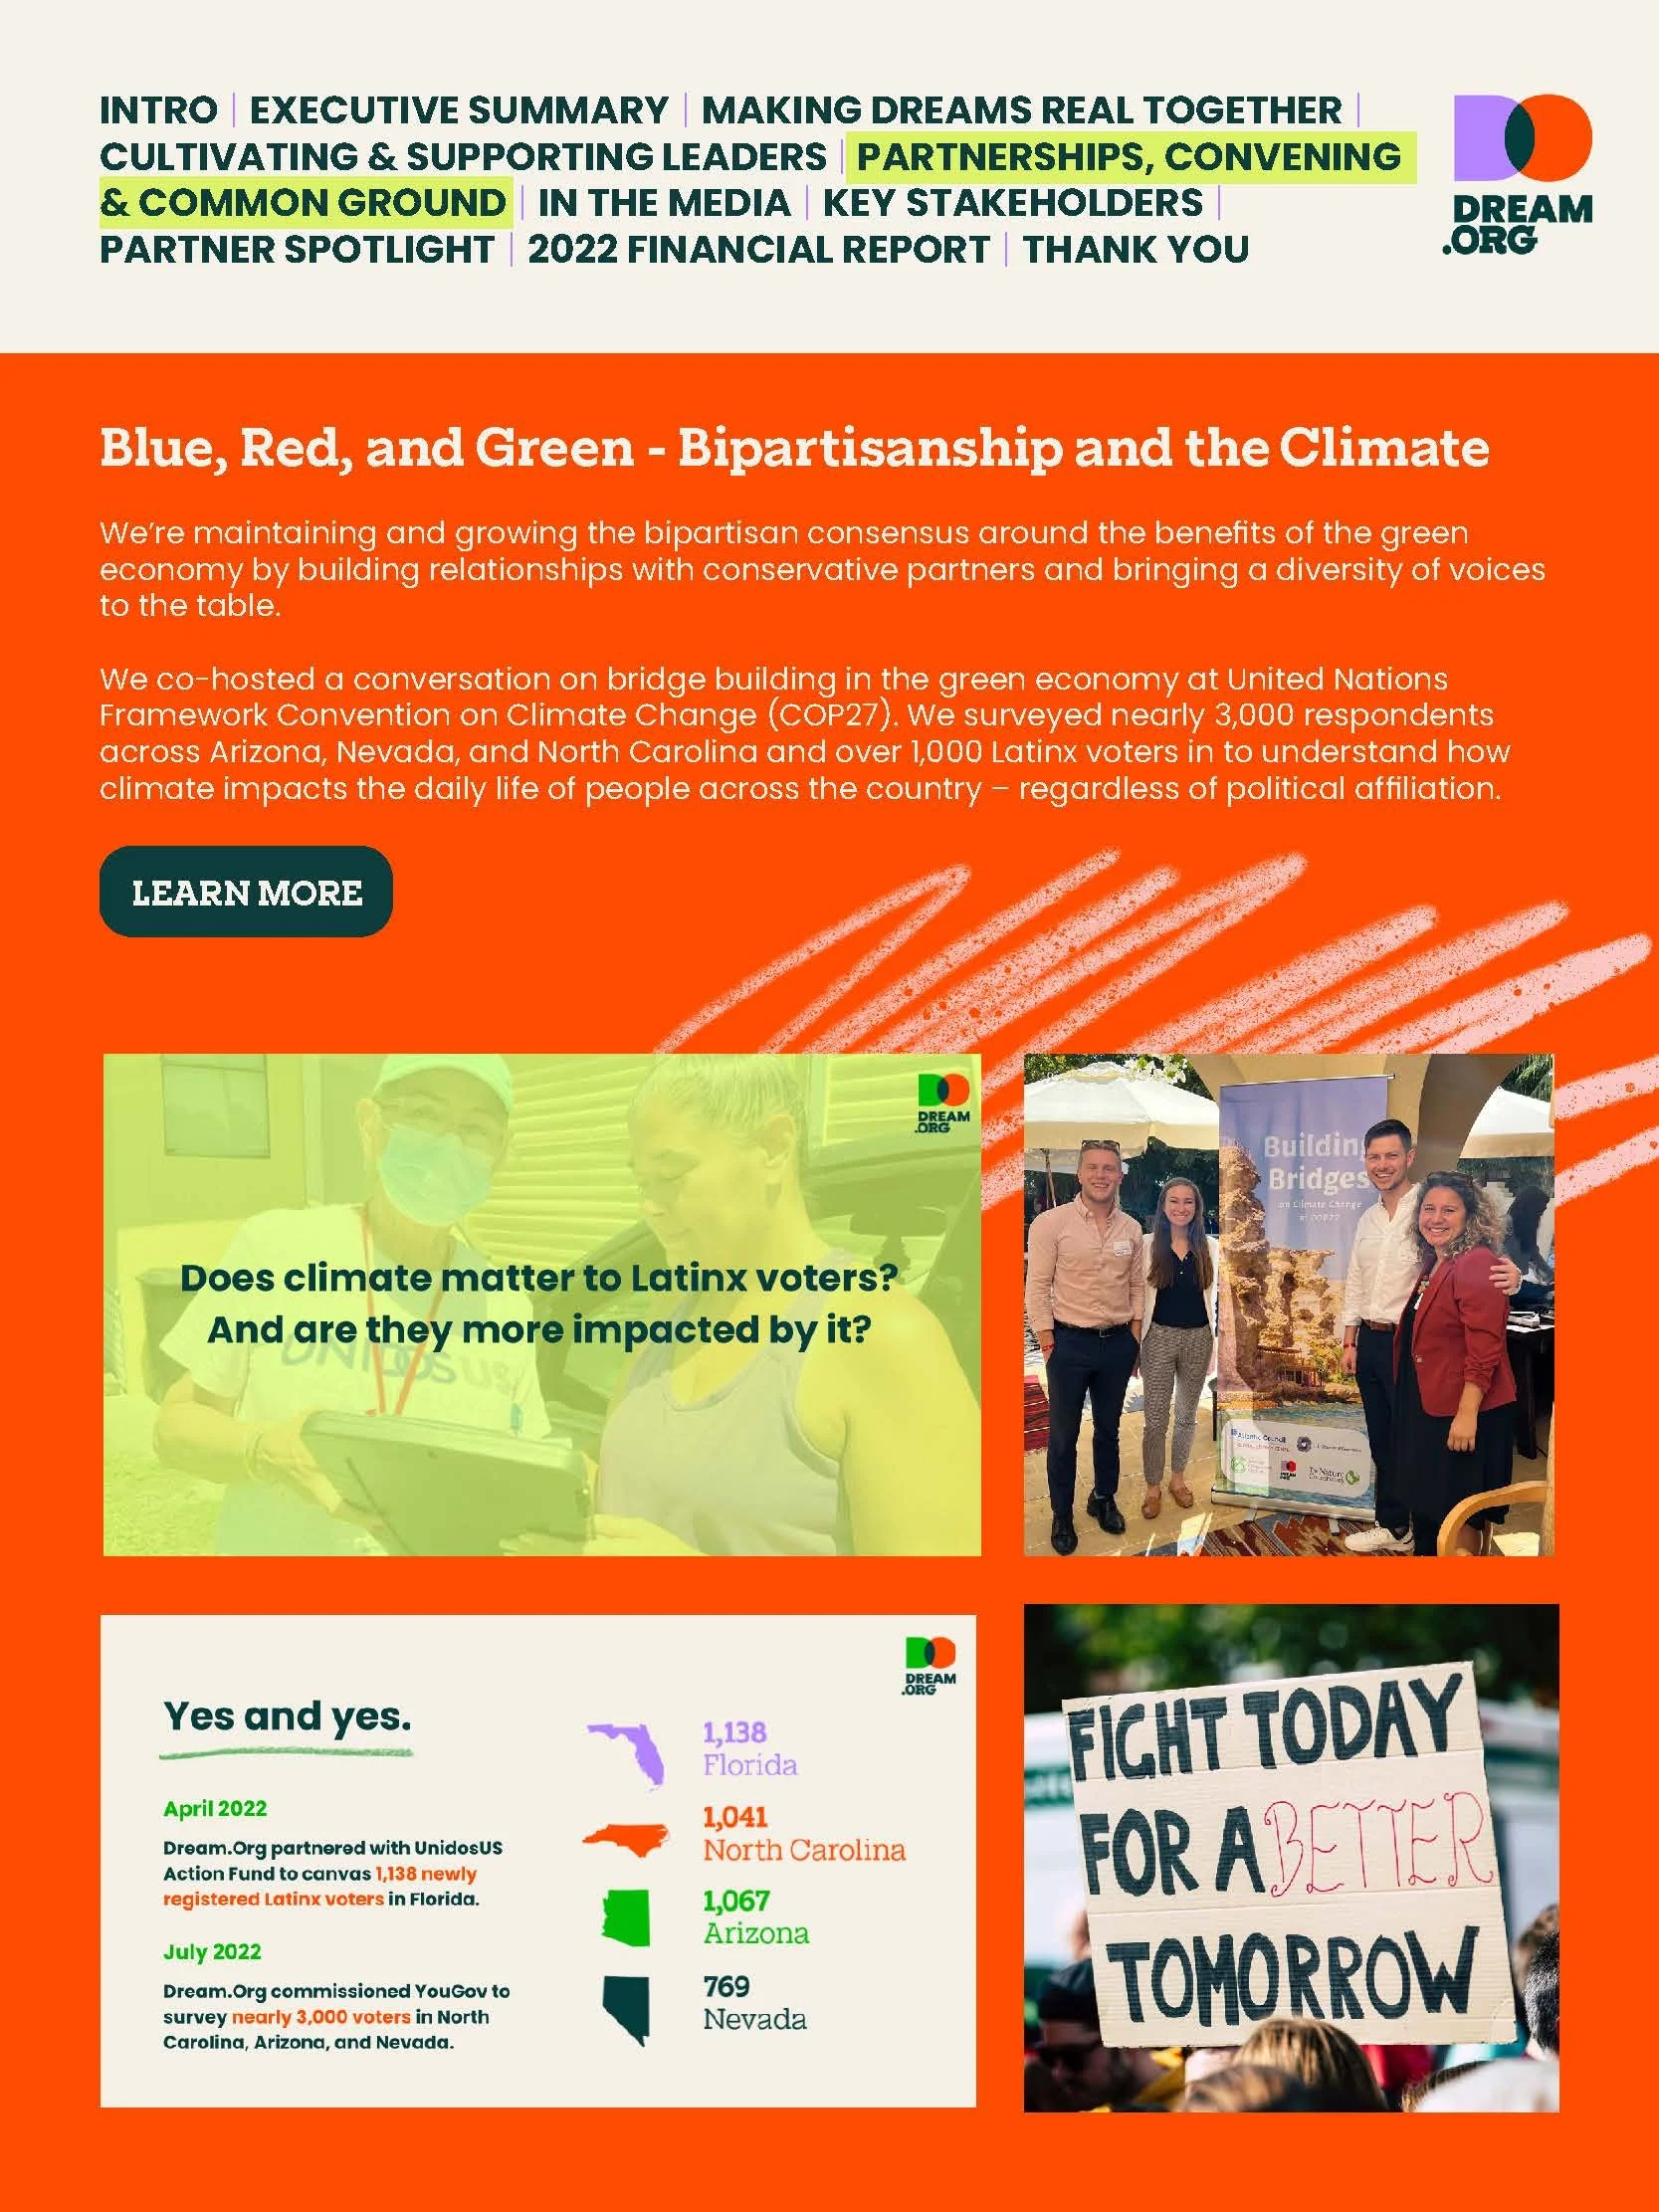
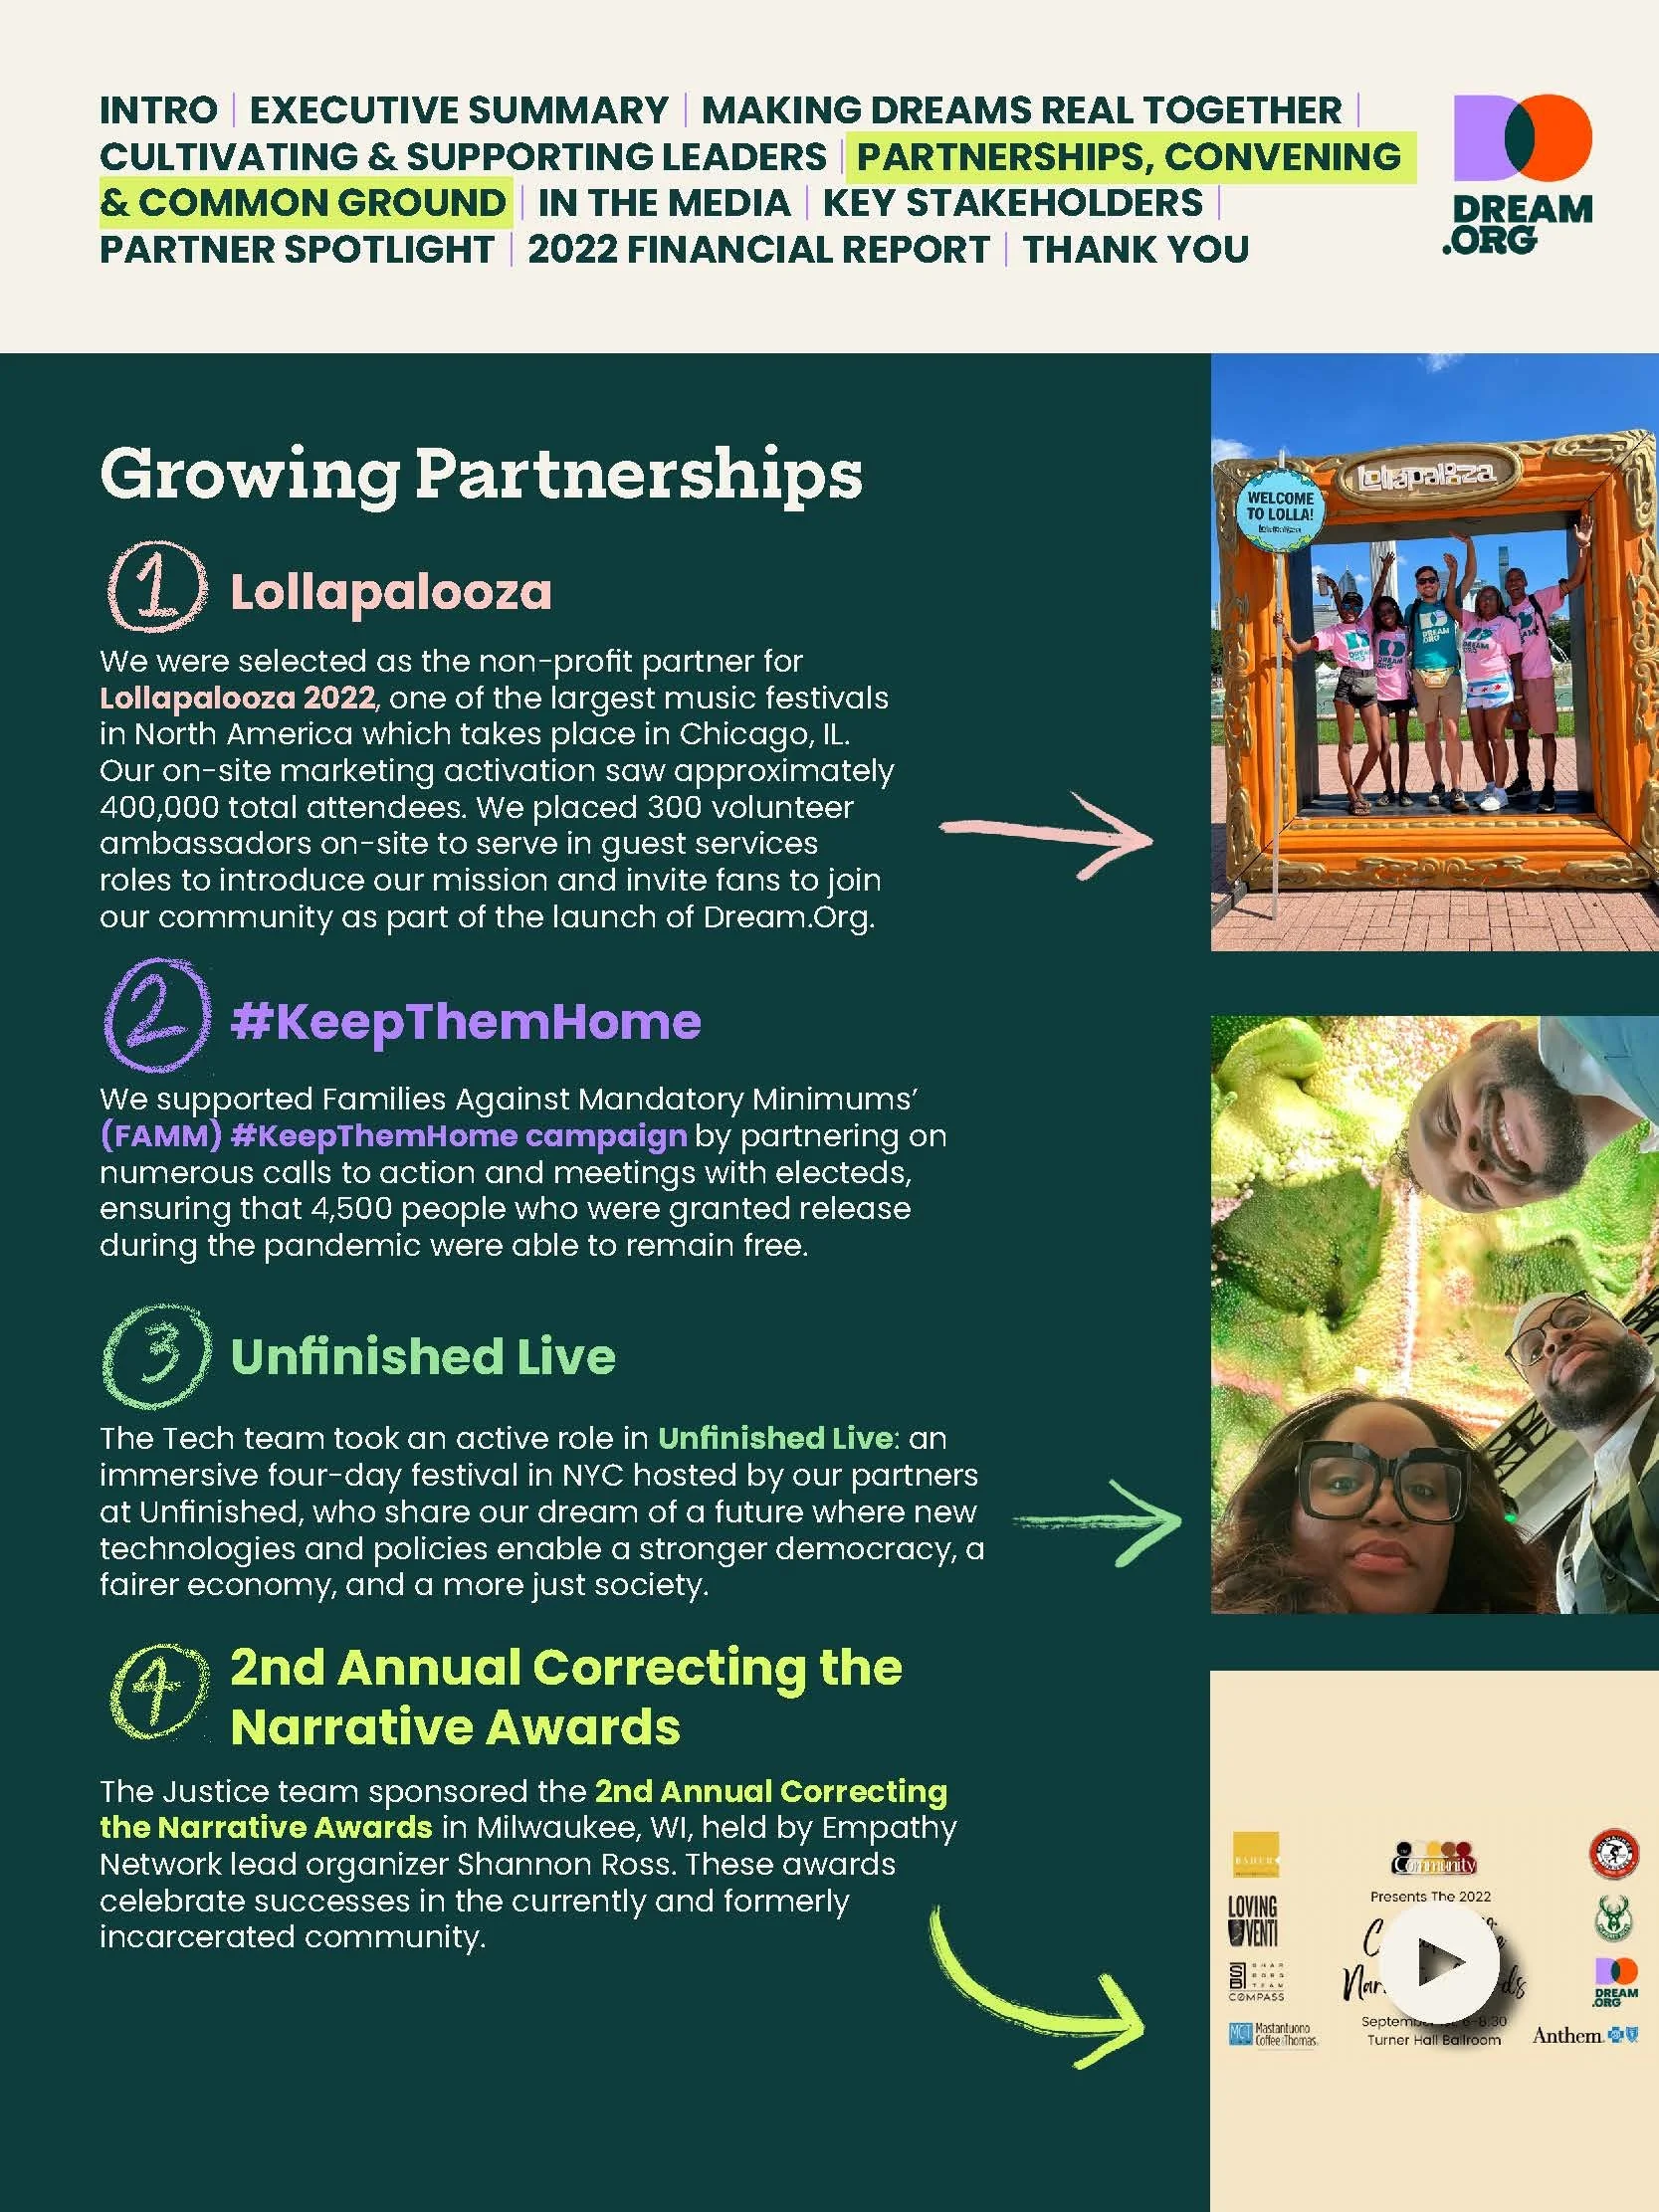
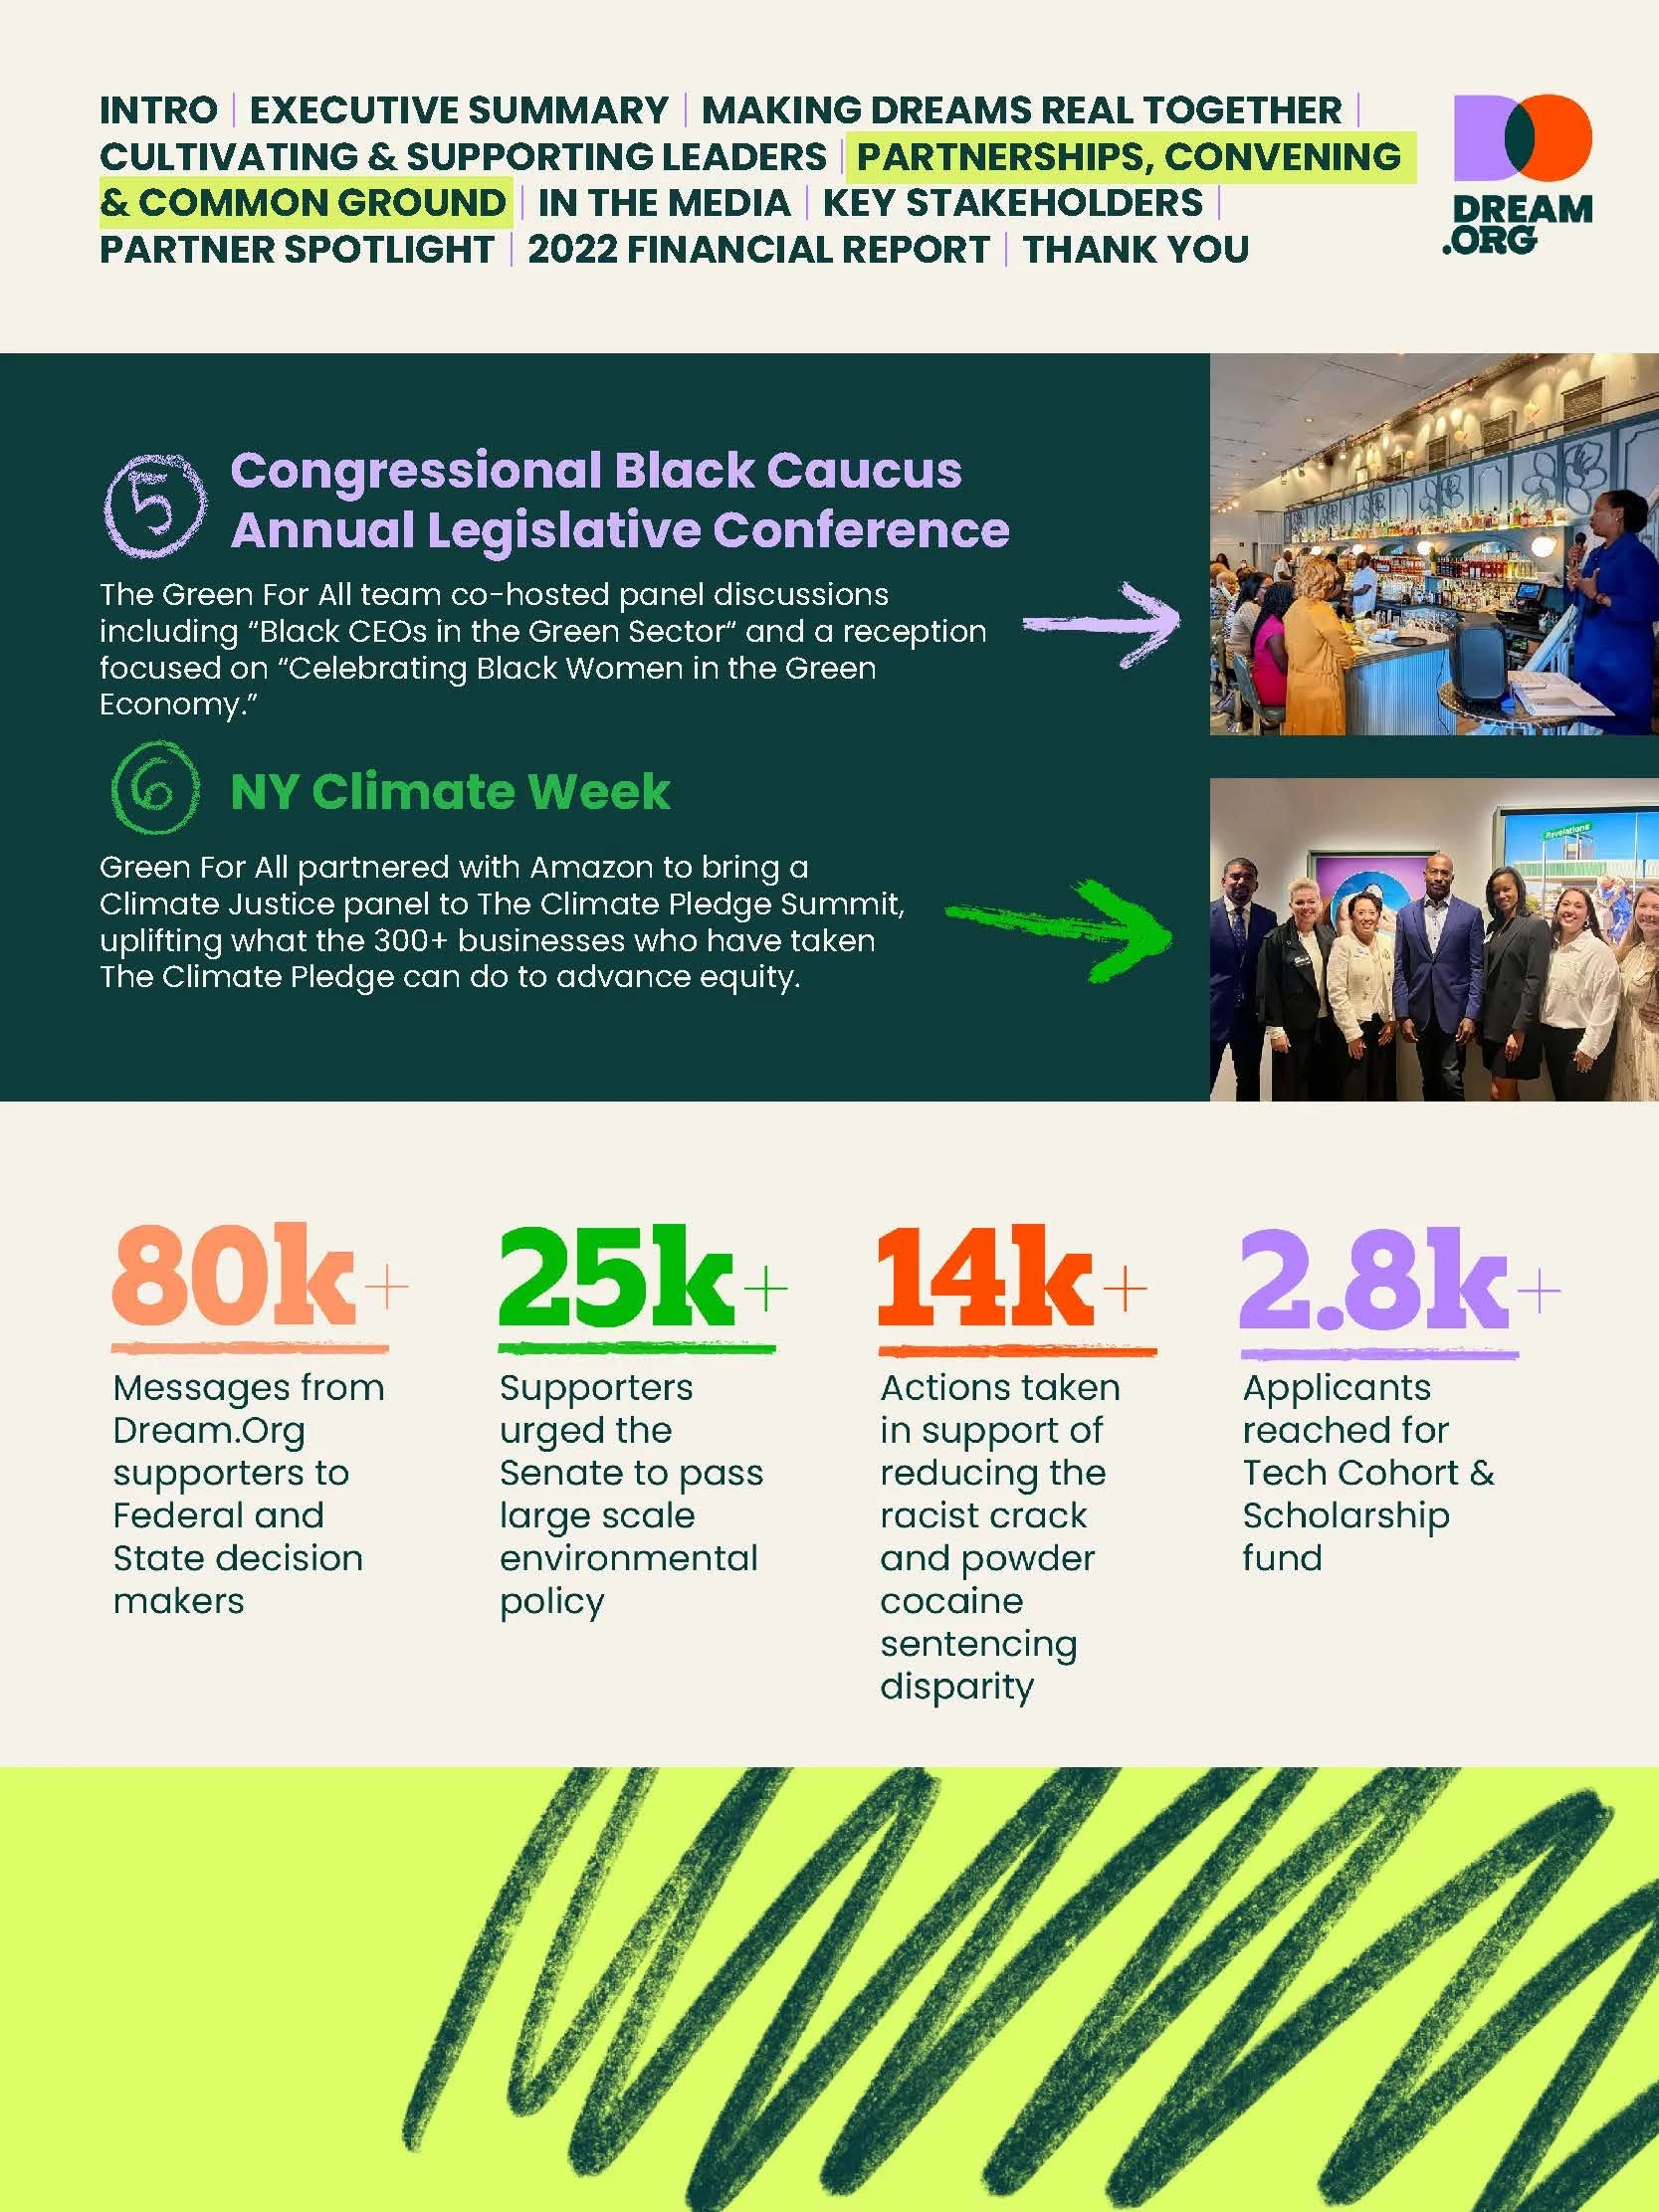
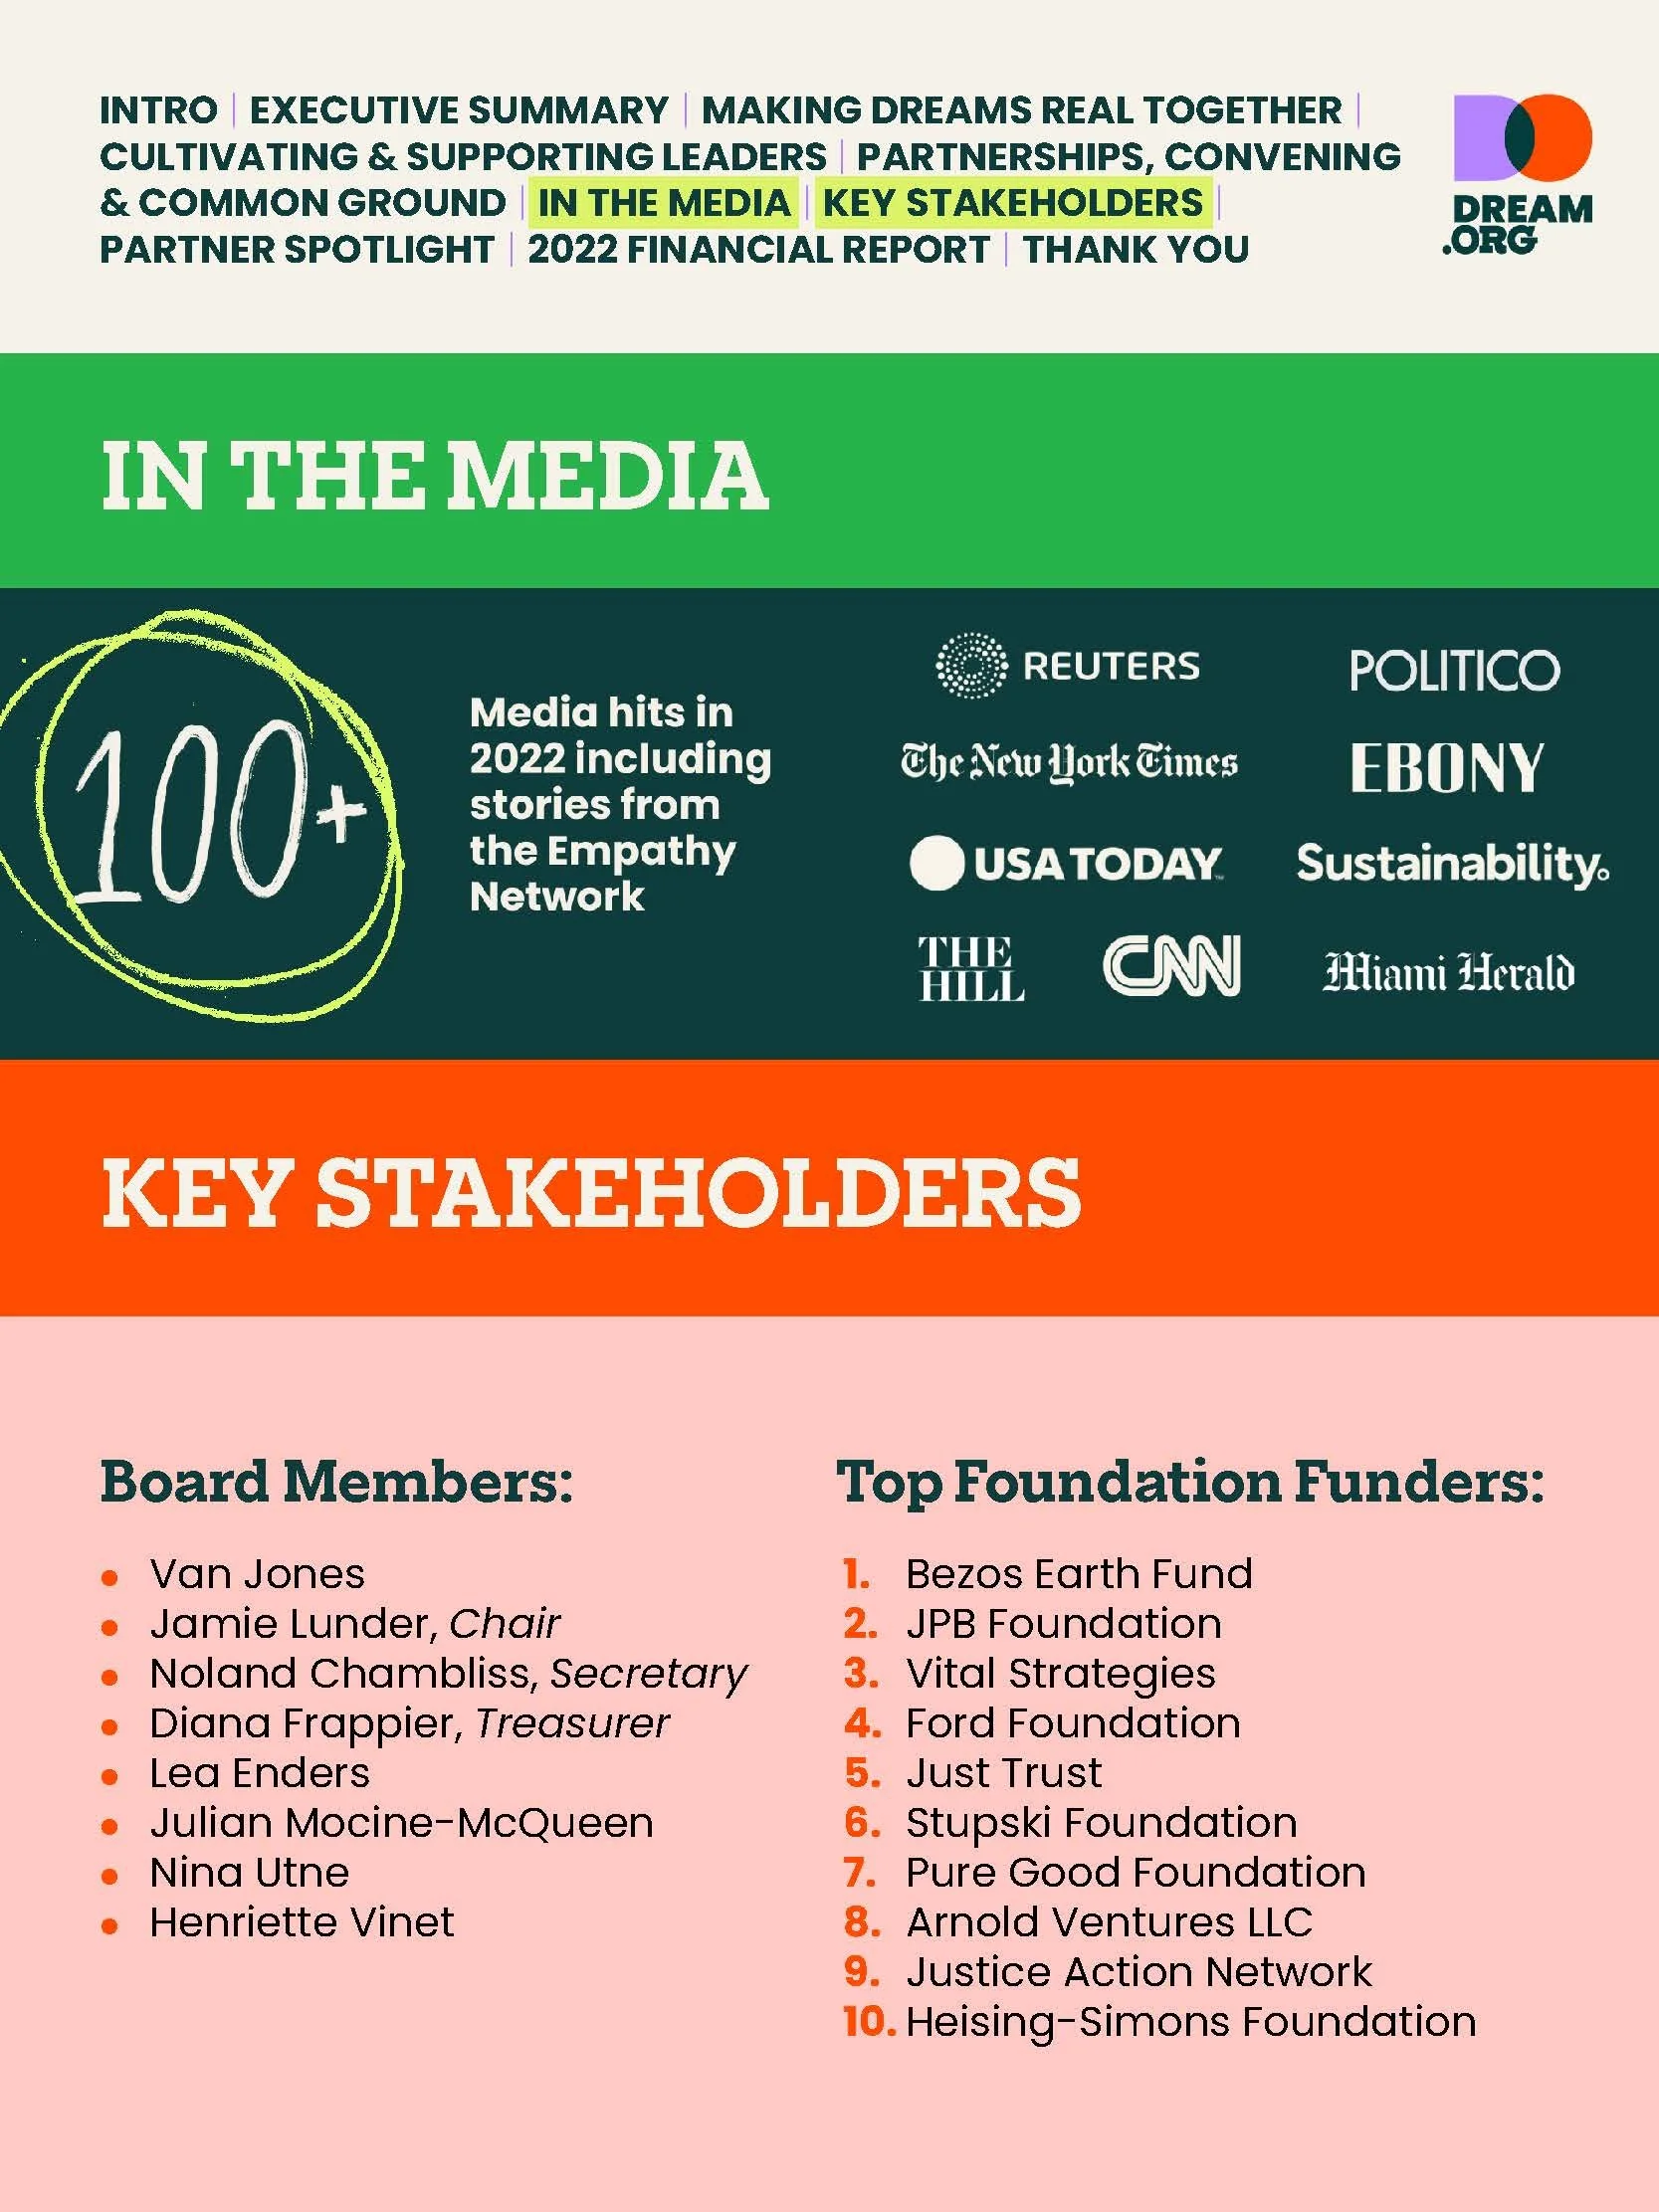
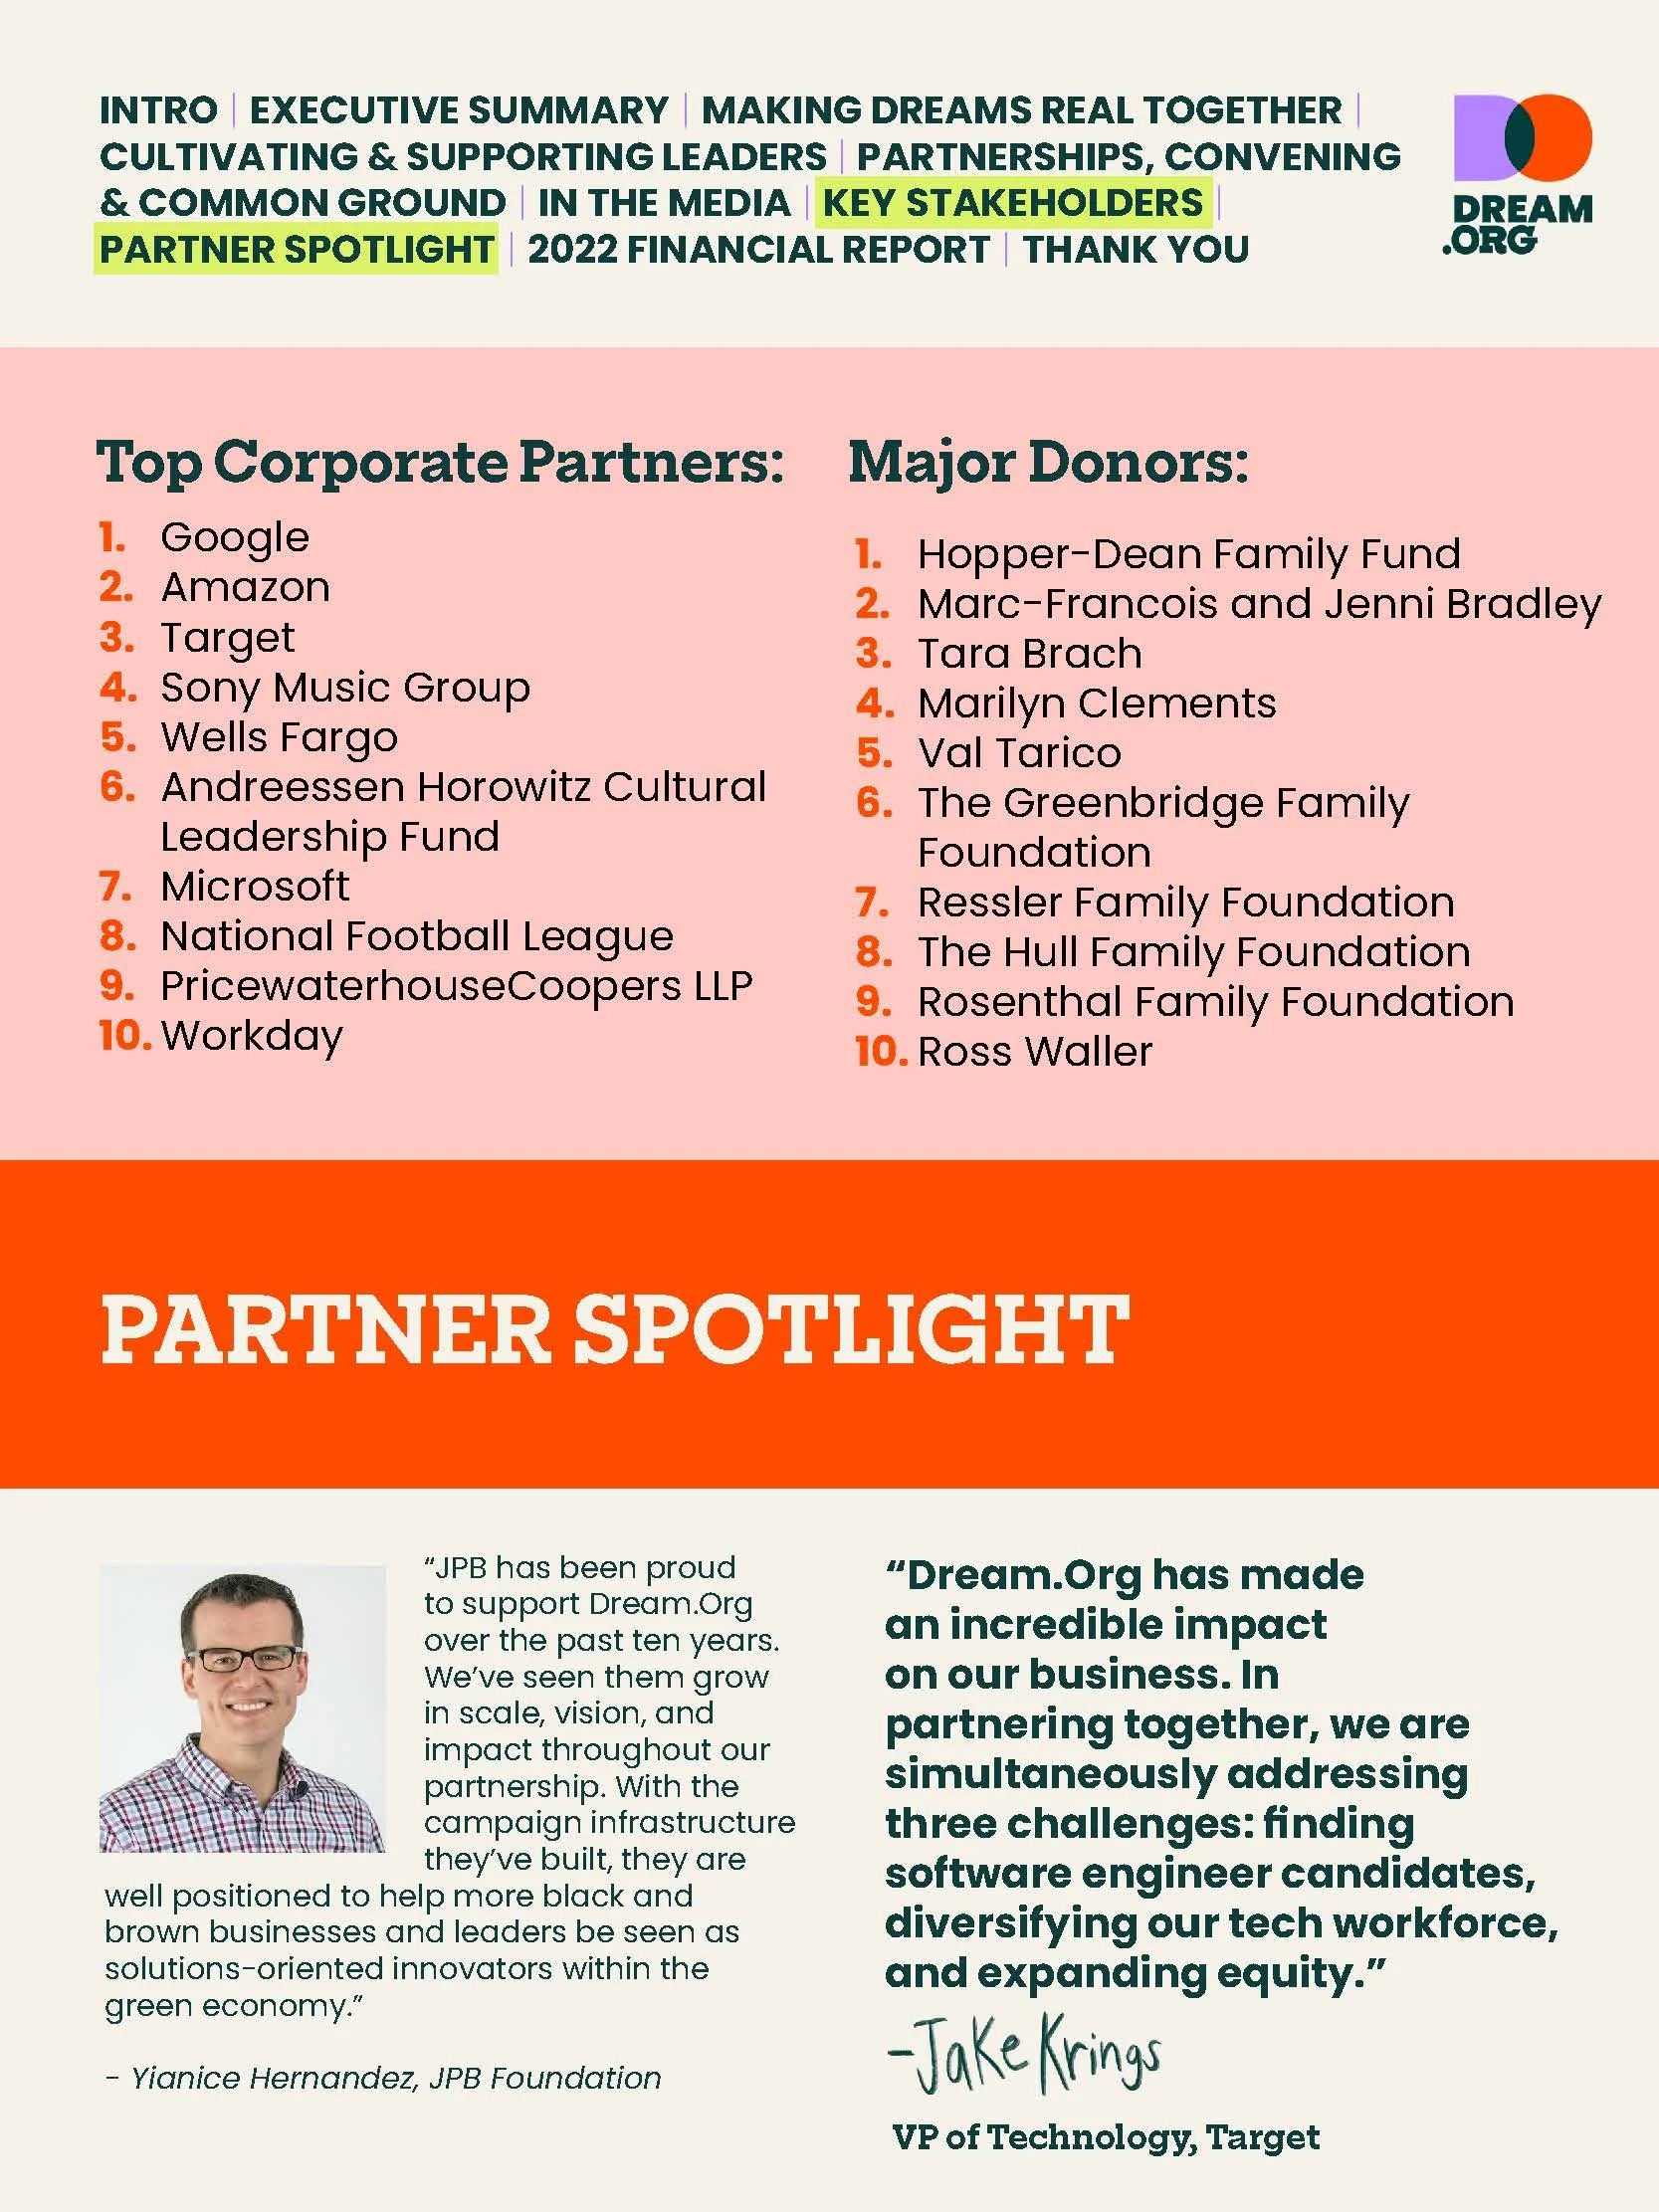
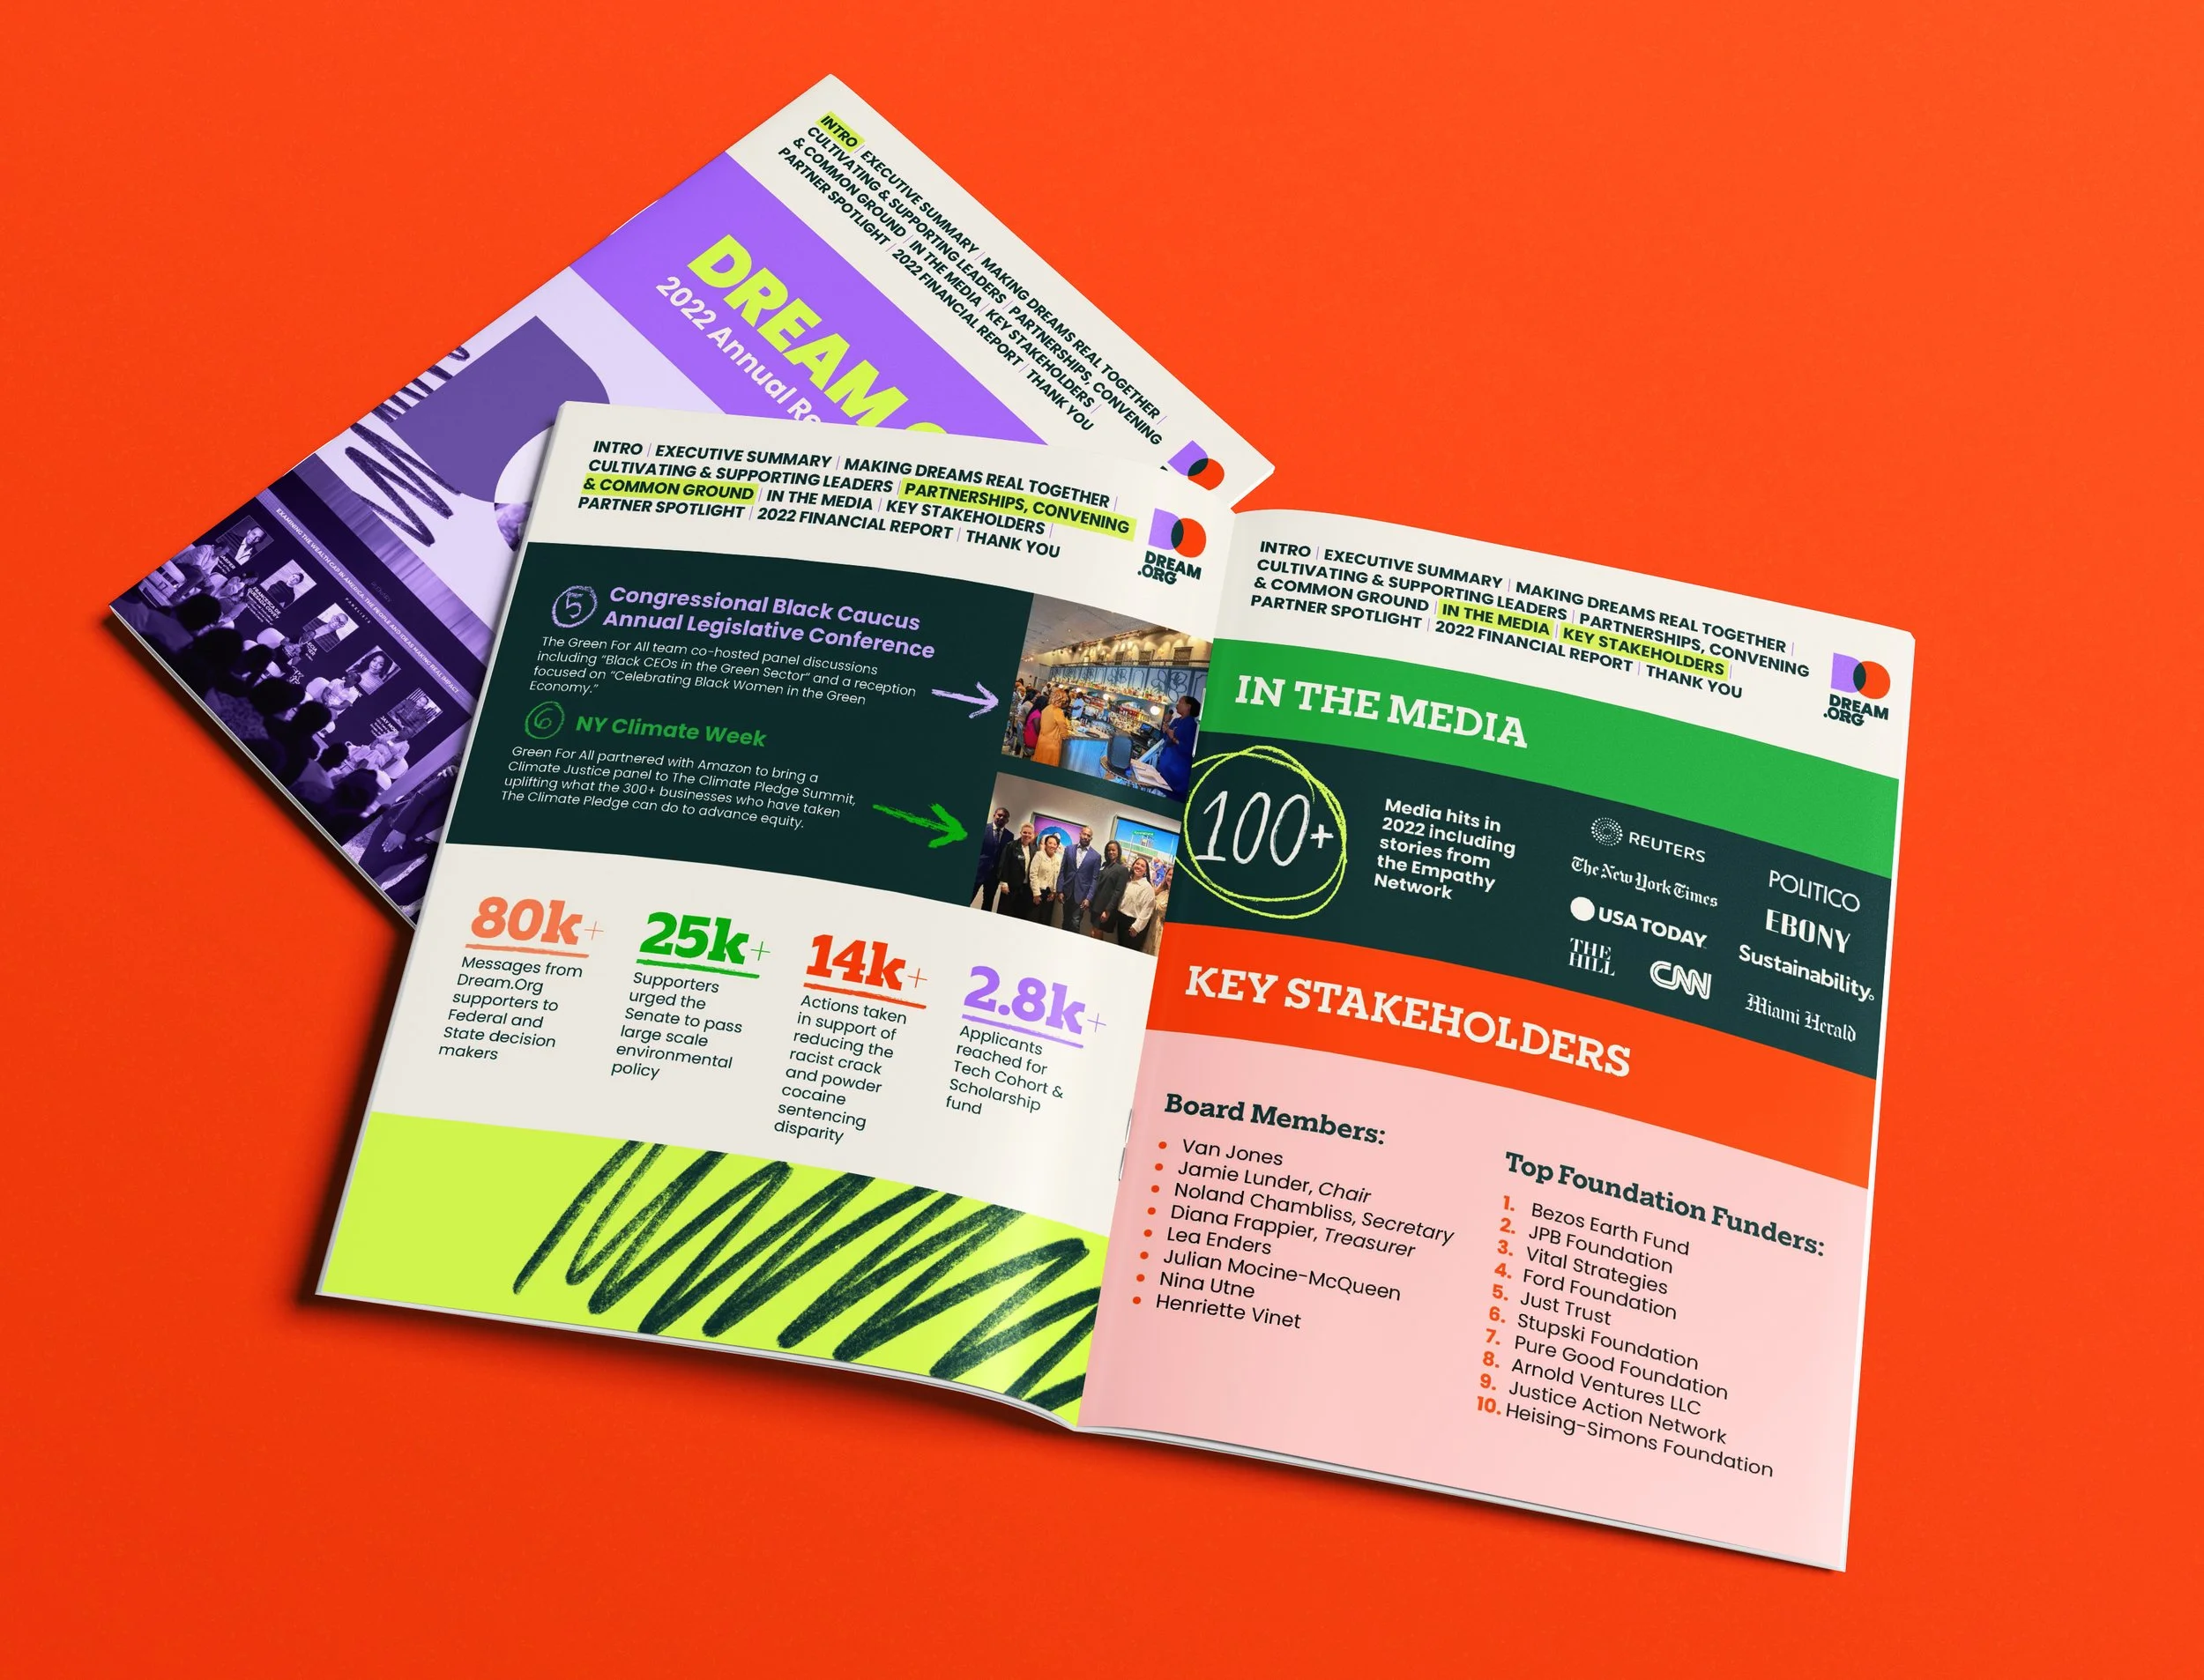
Dream.org needed an annual report communicating the organization's initiatives, accomplishments, partnerships, and impact across its various areas of work. The supplied content included written narratives, statistics, testimonials, and supporting materials.
The Challenge
With a wide variety of content spanning multiple initiatives, the challenge was to create a cohesive publication that could tell different stories while maintaining a consistent visual identity. Each section needed to feel engaging and distinct without losing the overall connection to Dream.org's brand.
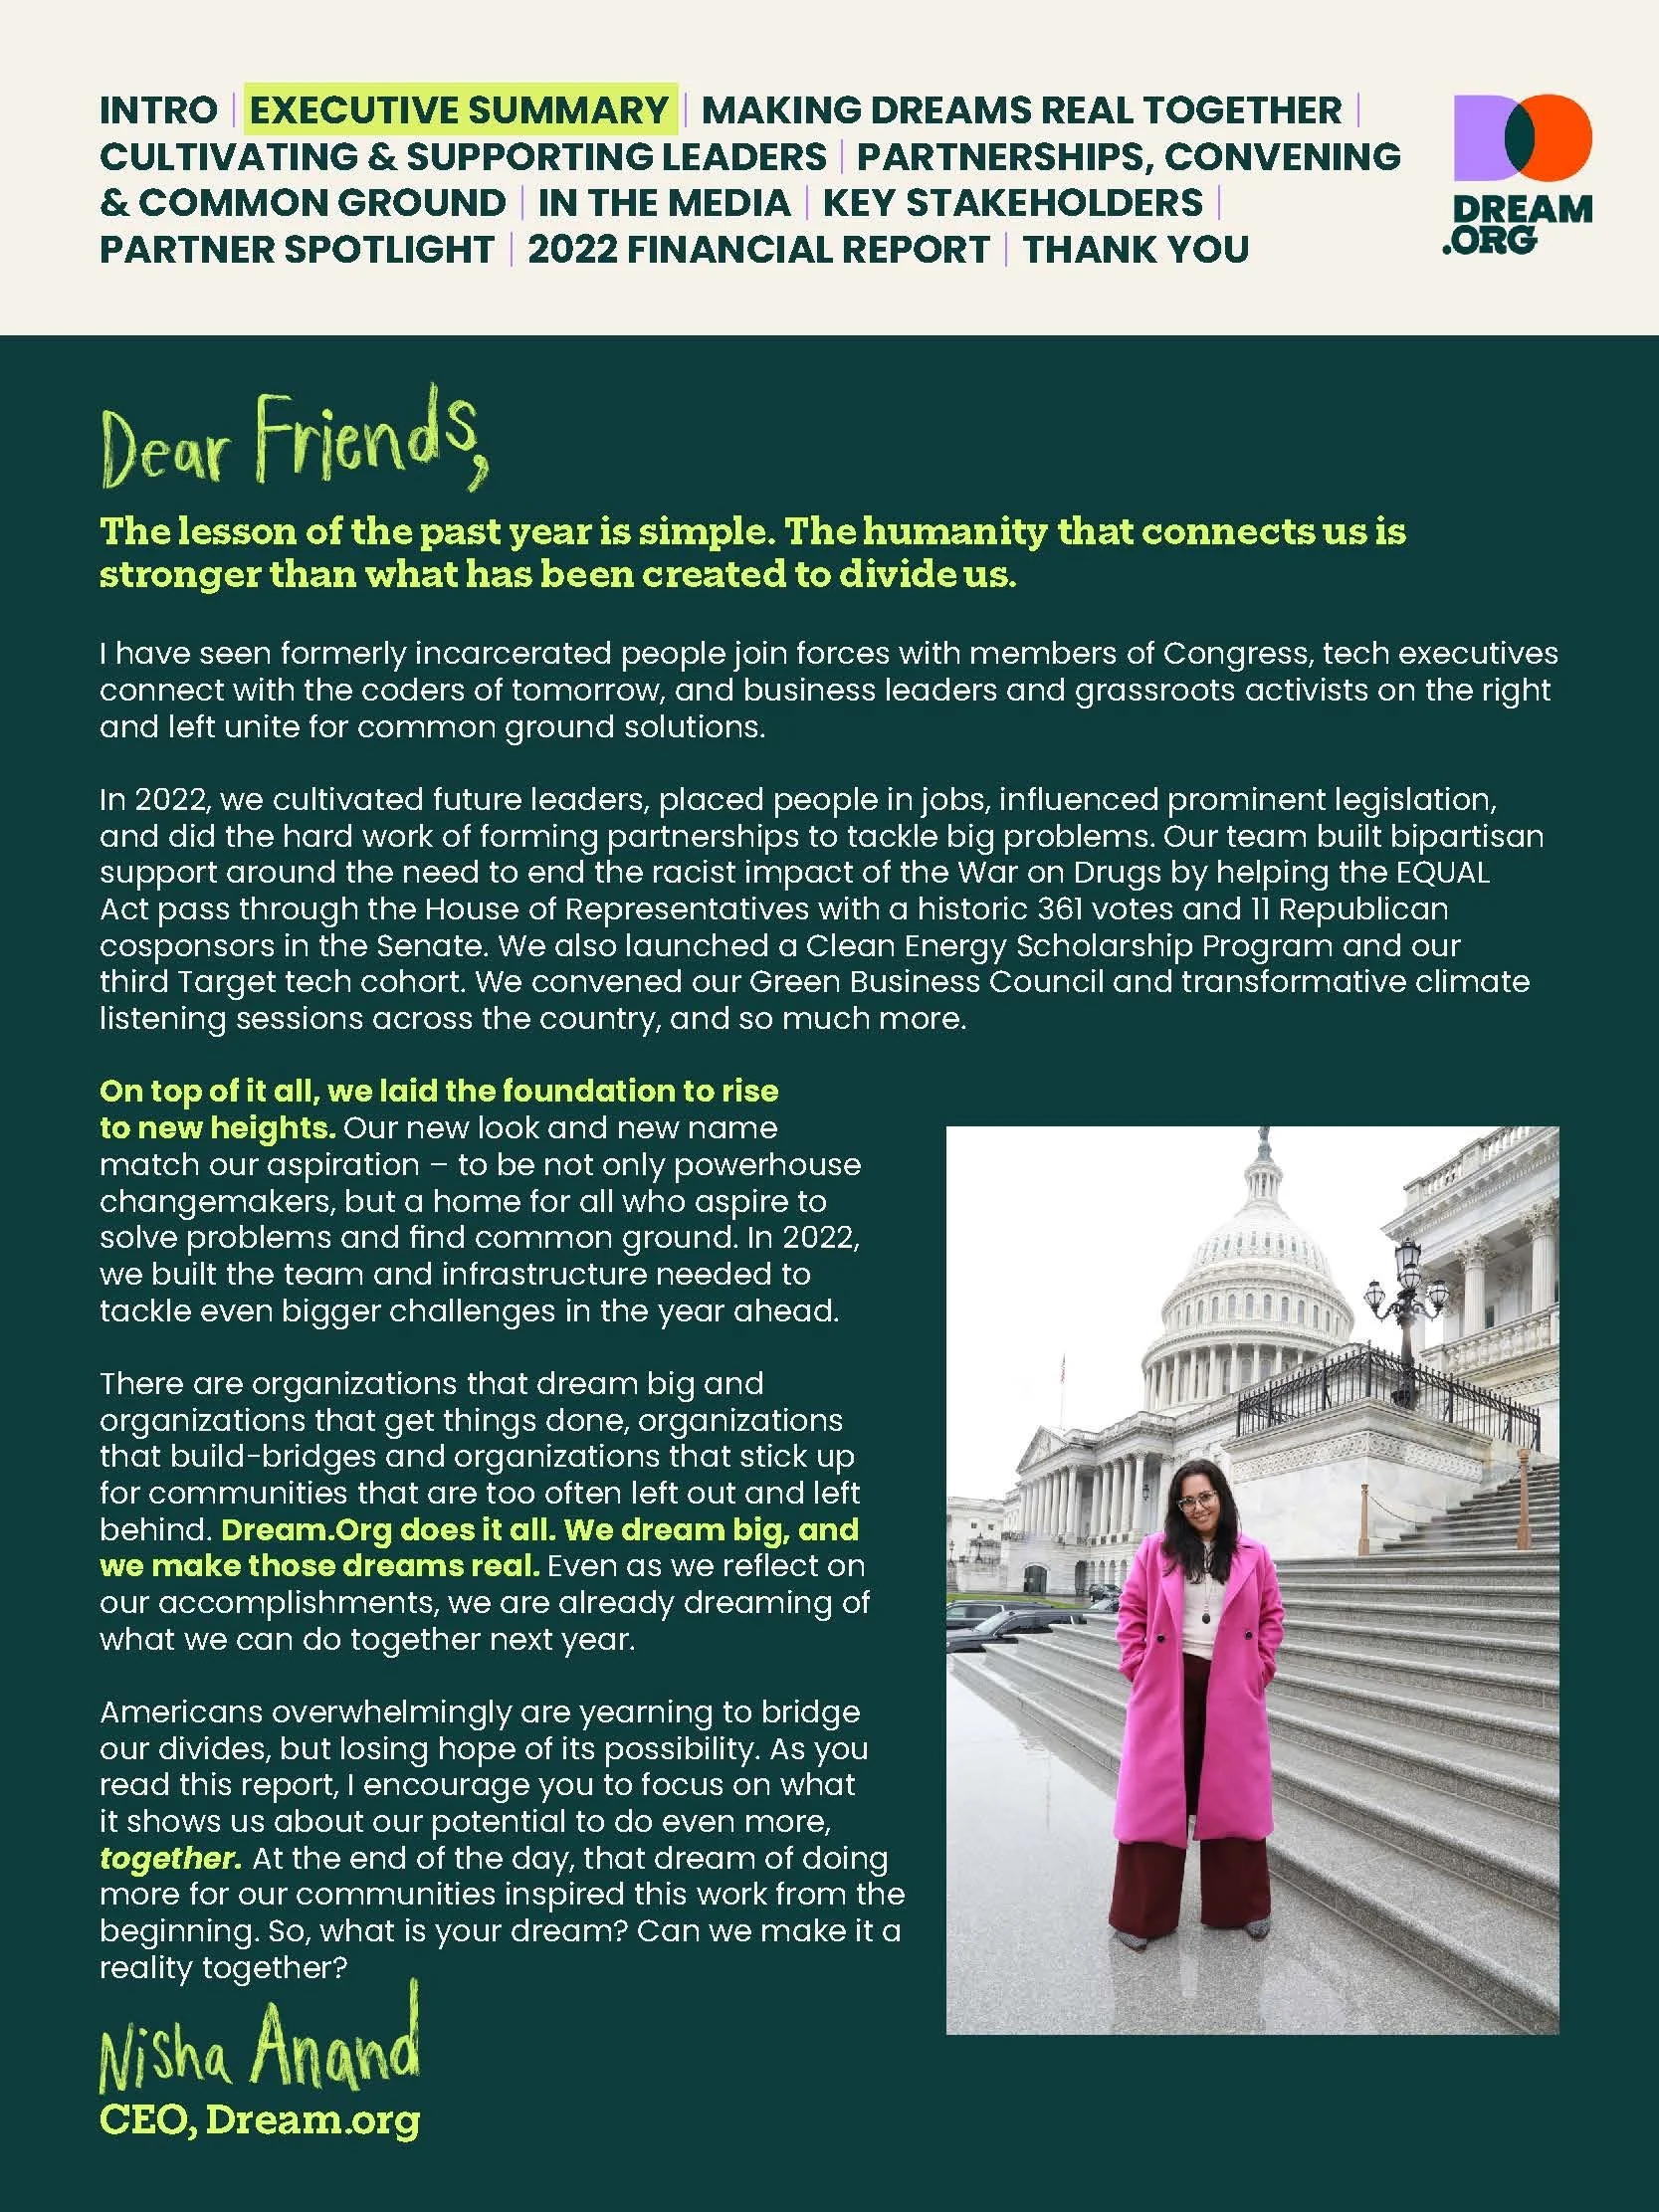
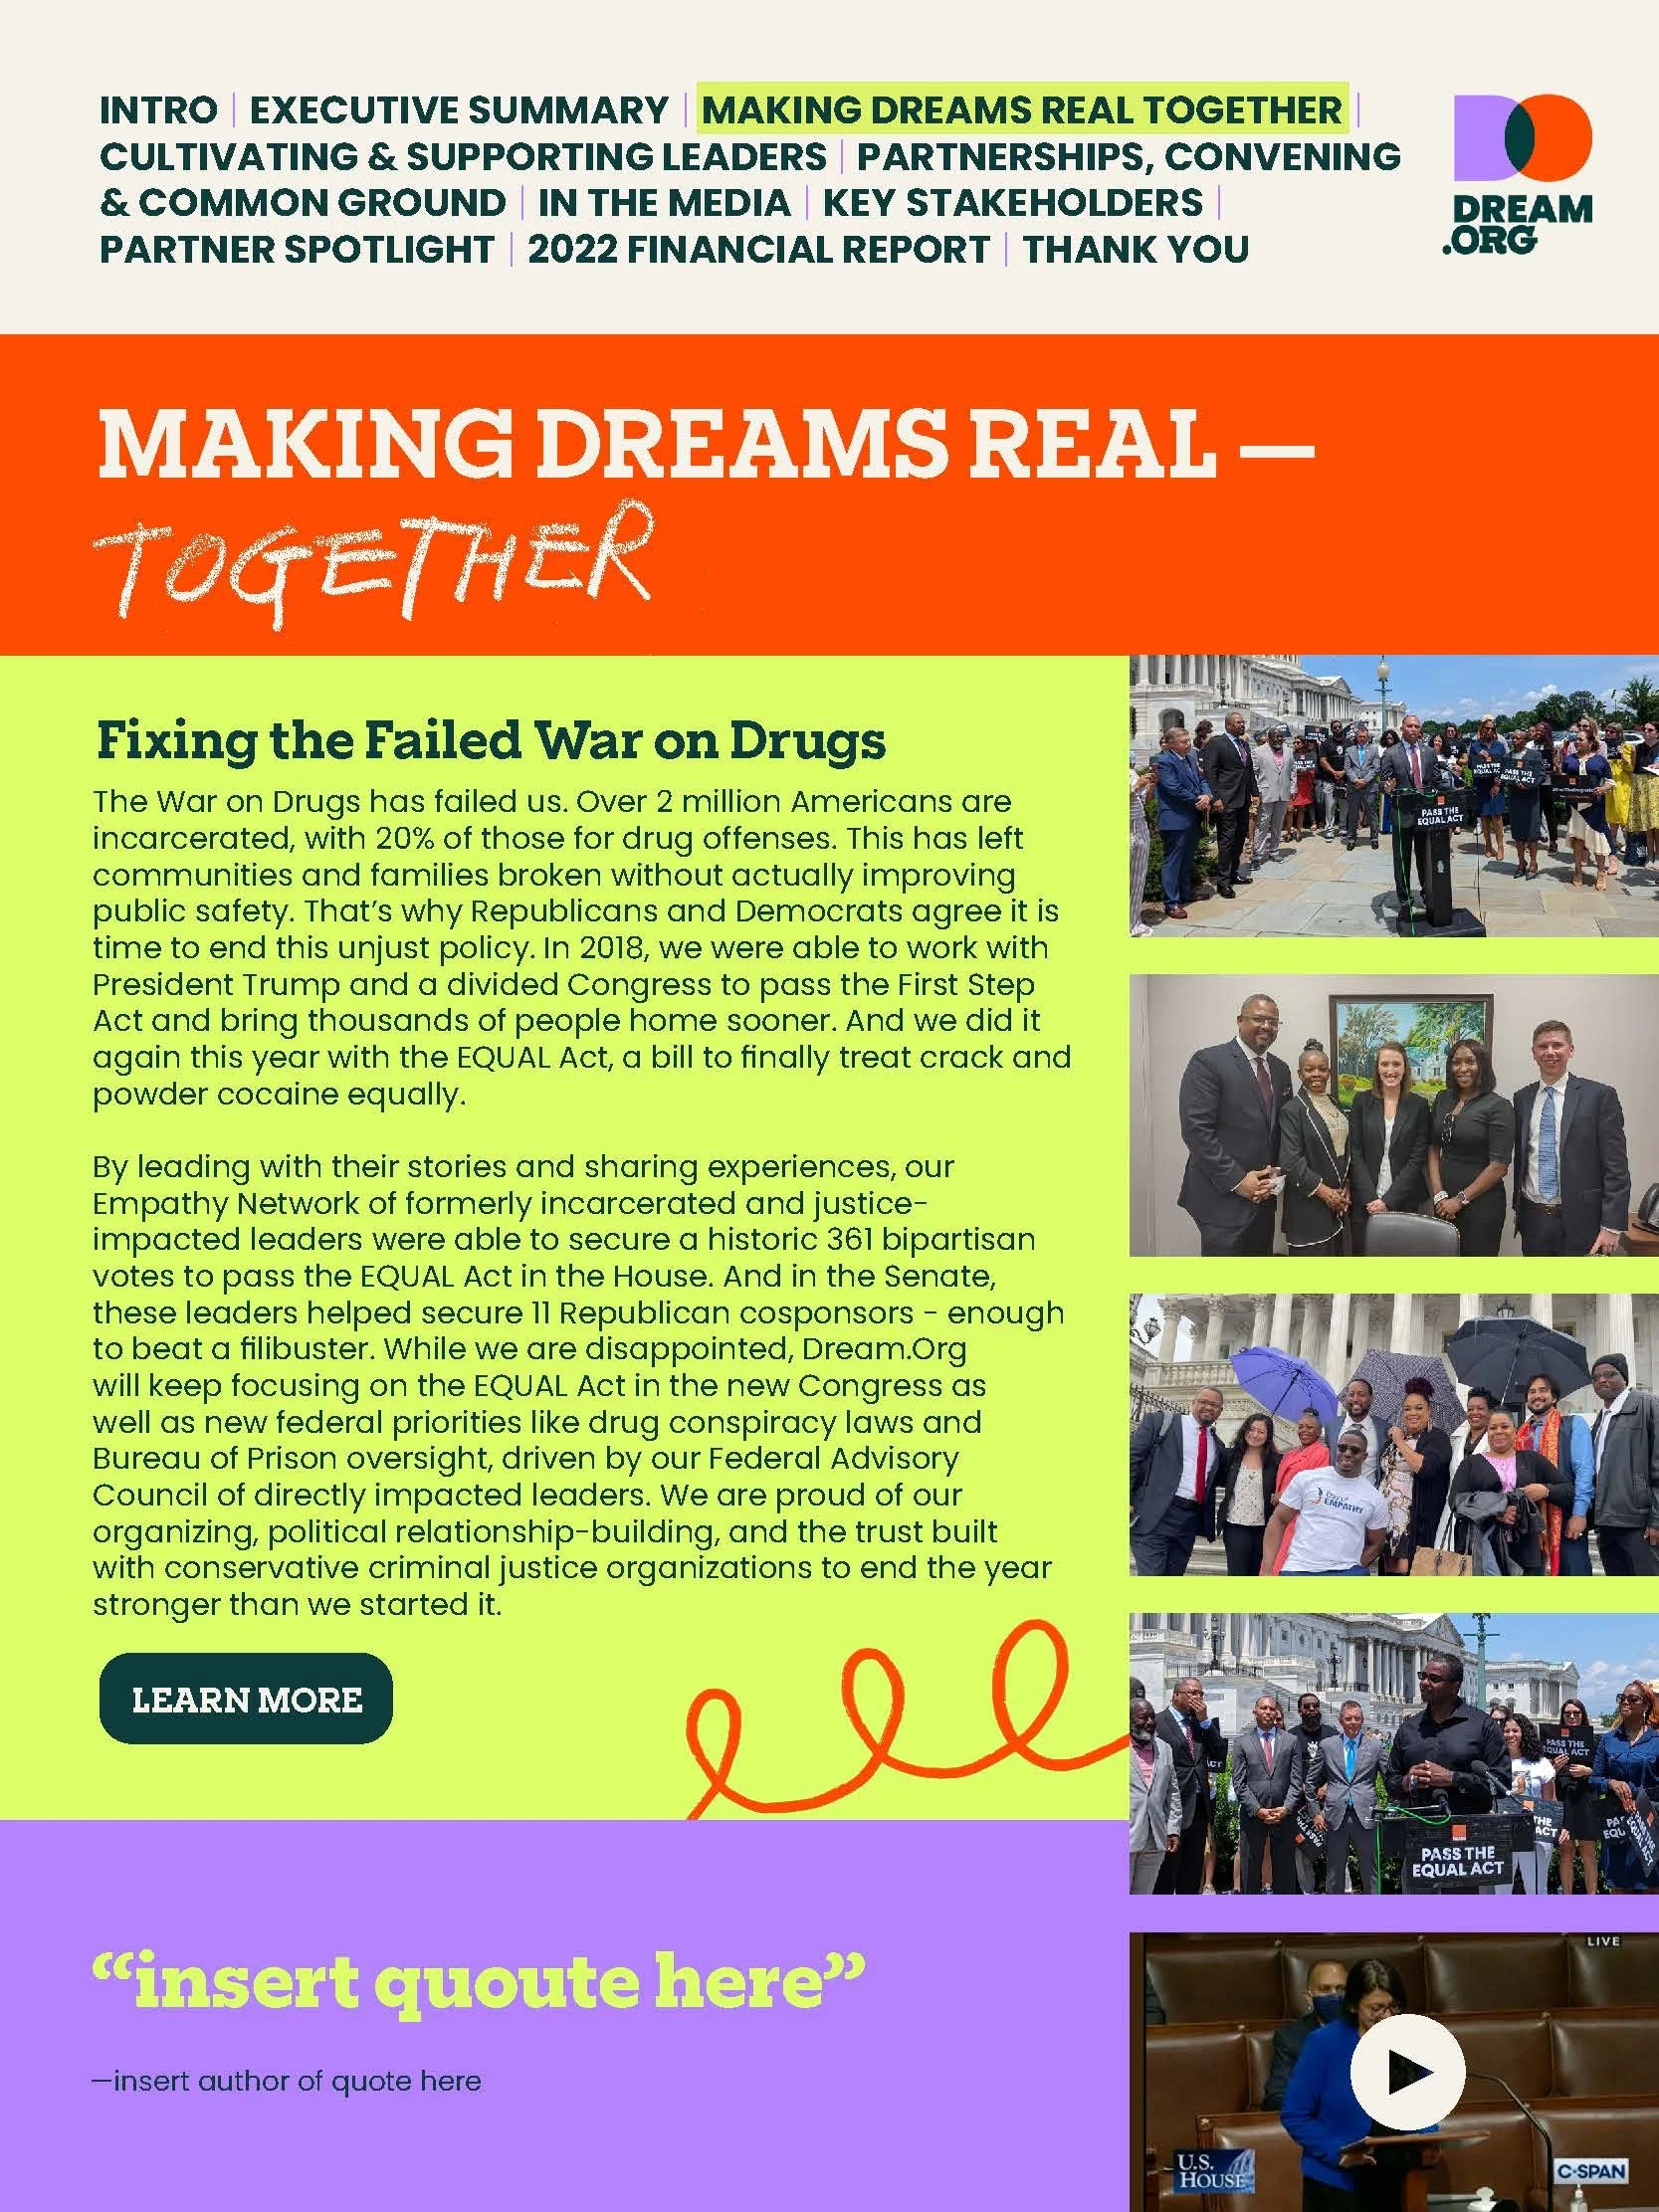
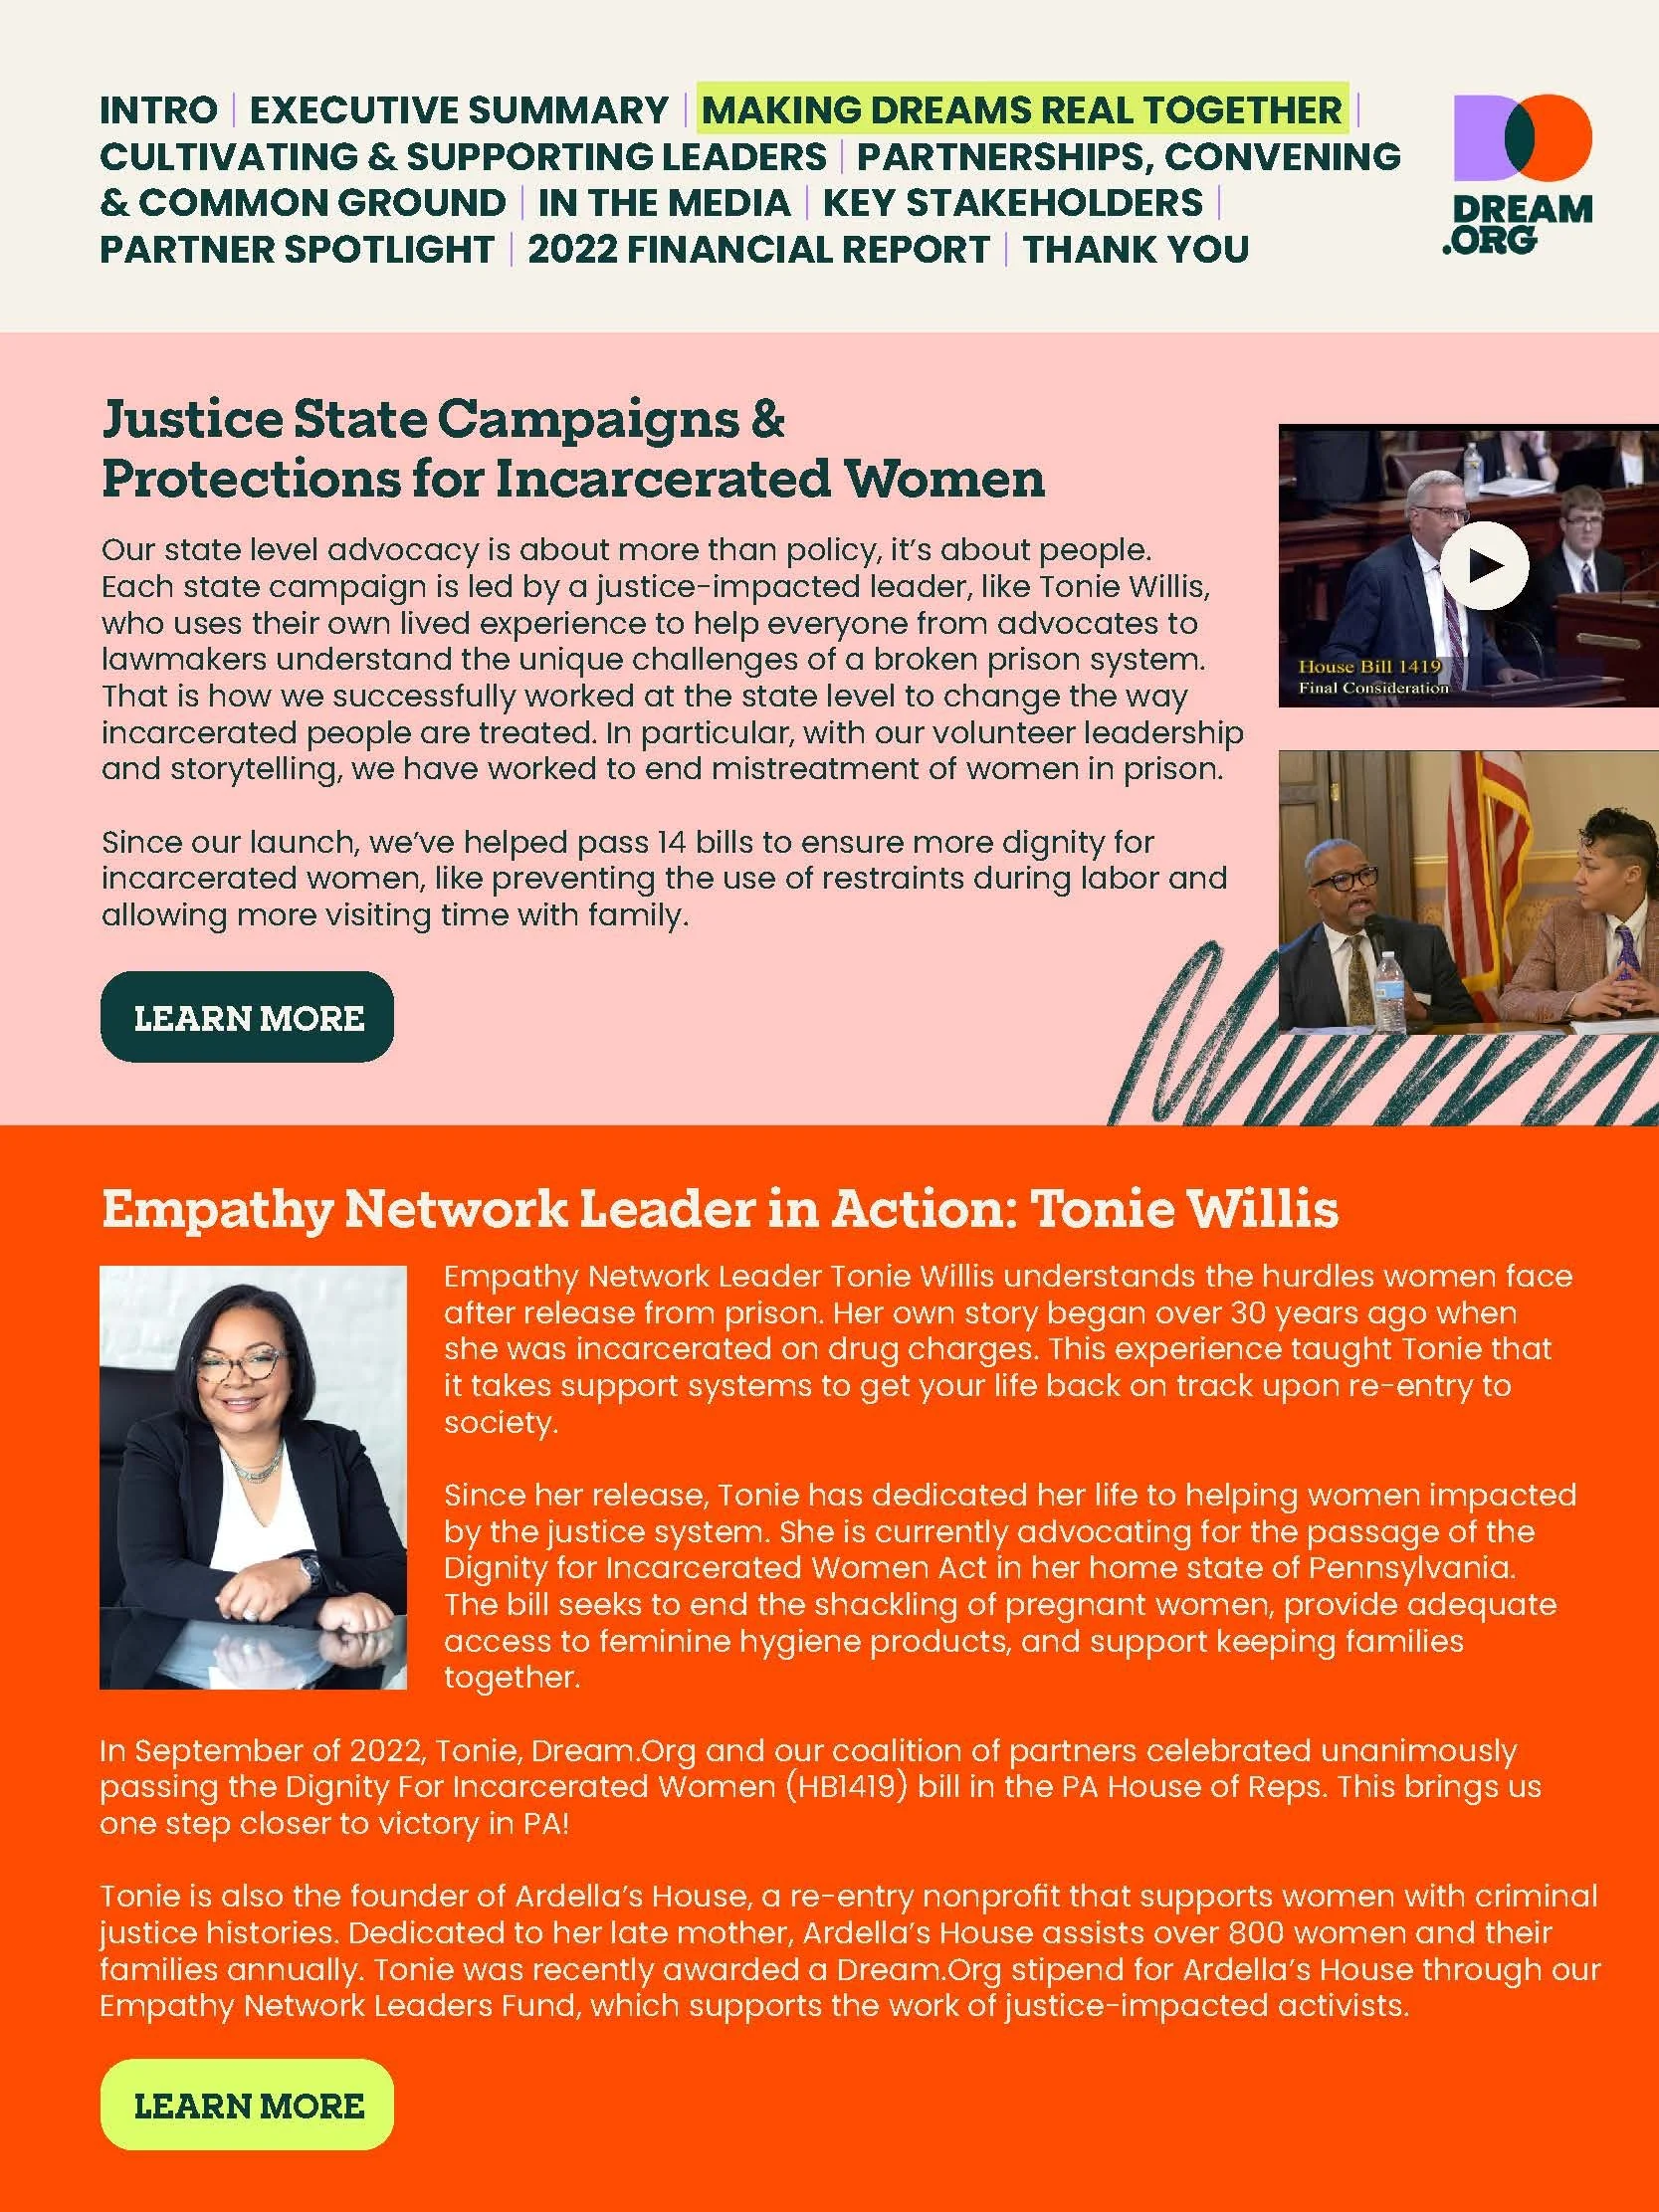
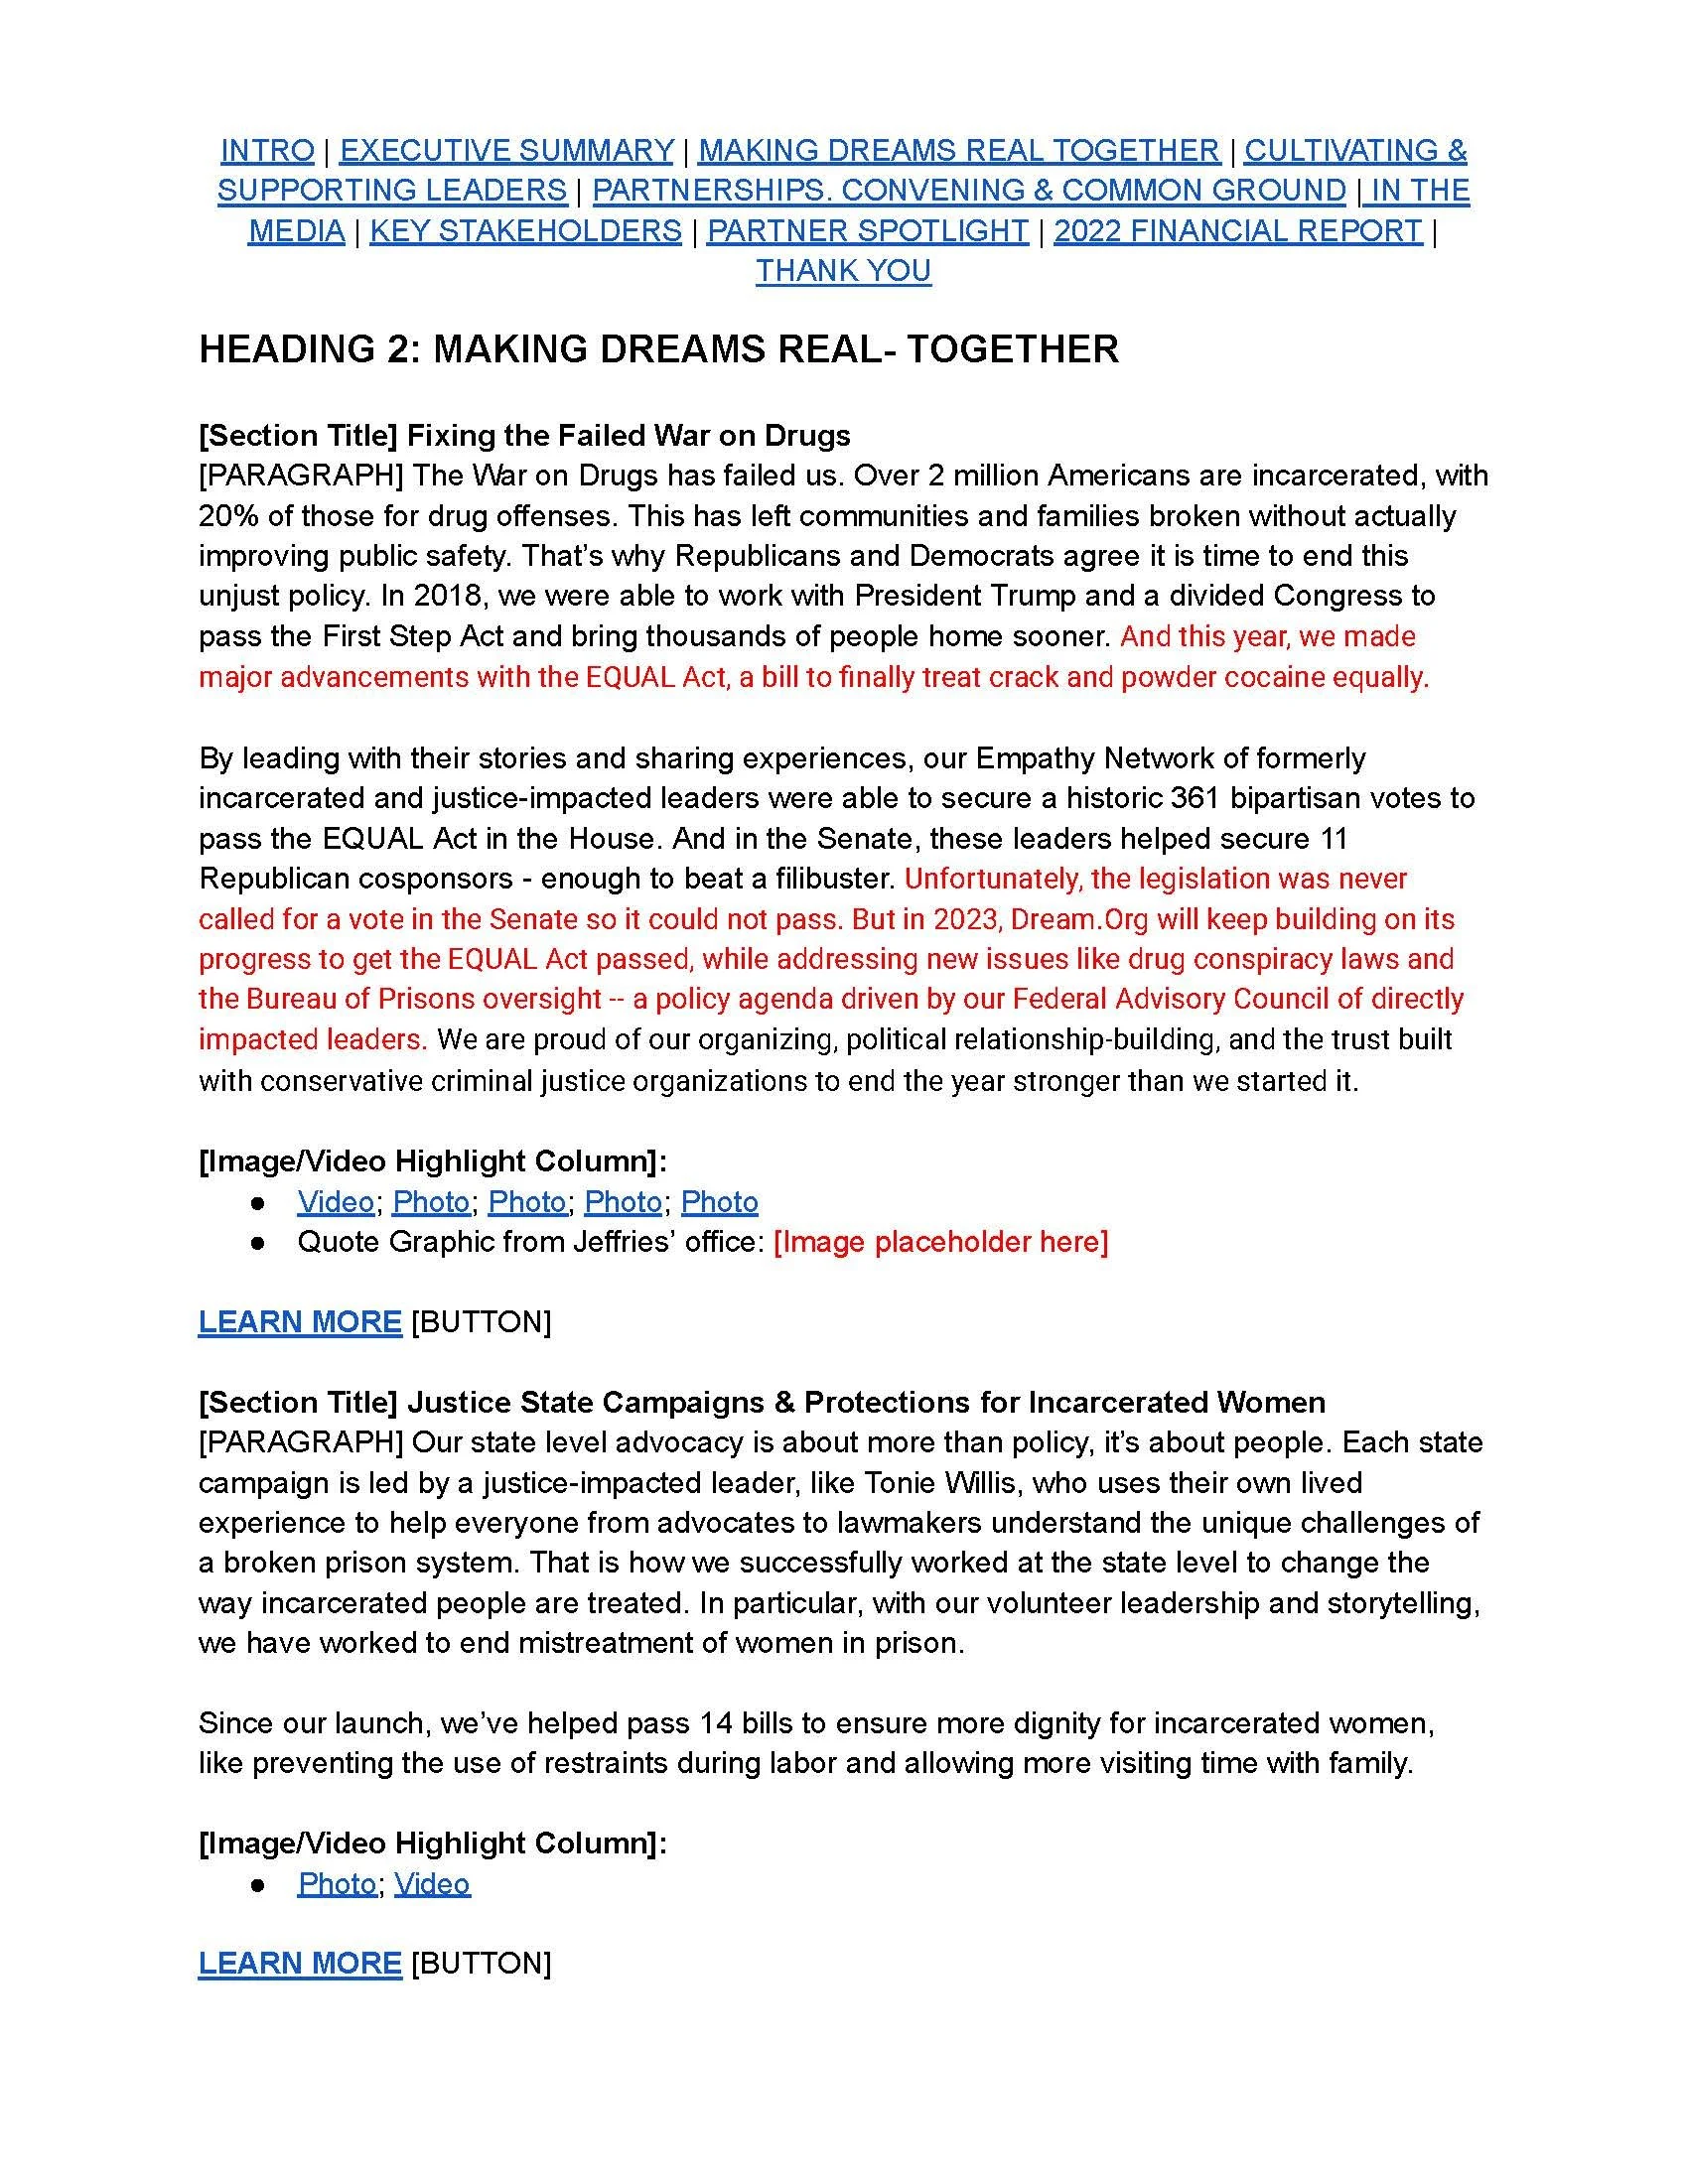
The original client-supplied document outlining the report's content, section structure, statistics, testimonials, and visual placeholders.
Before
After
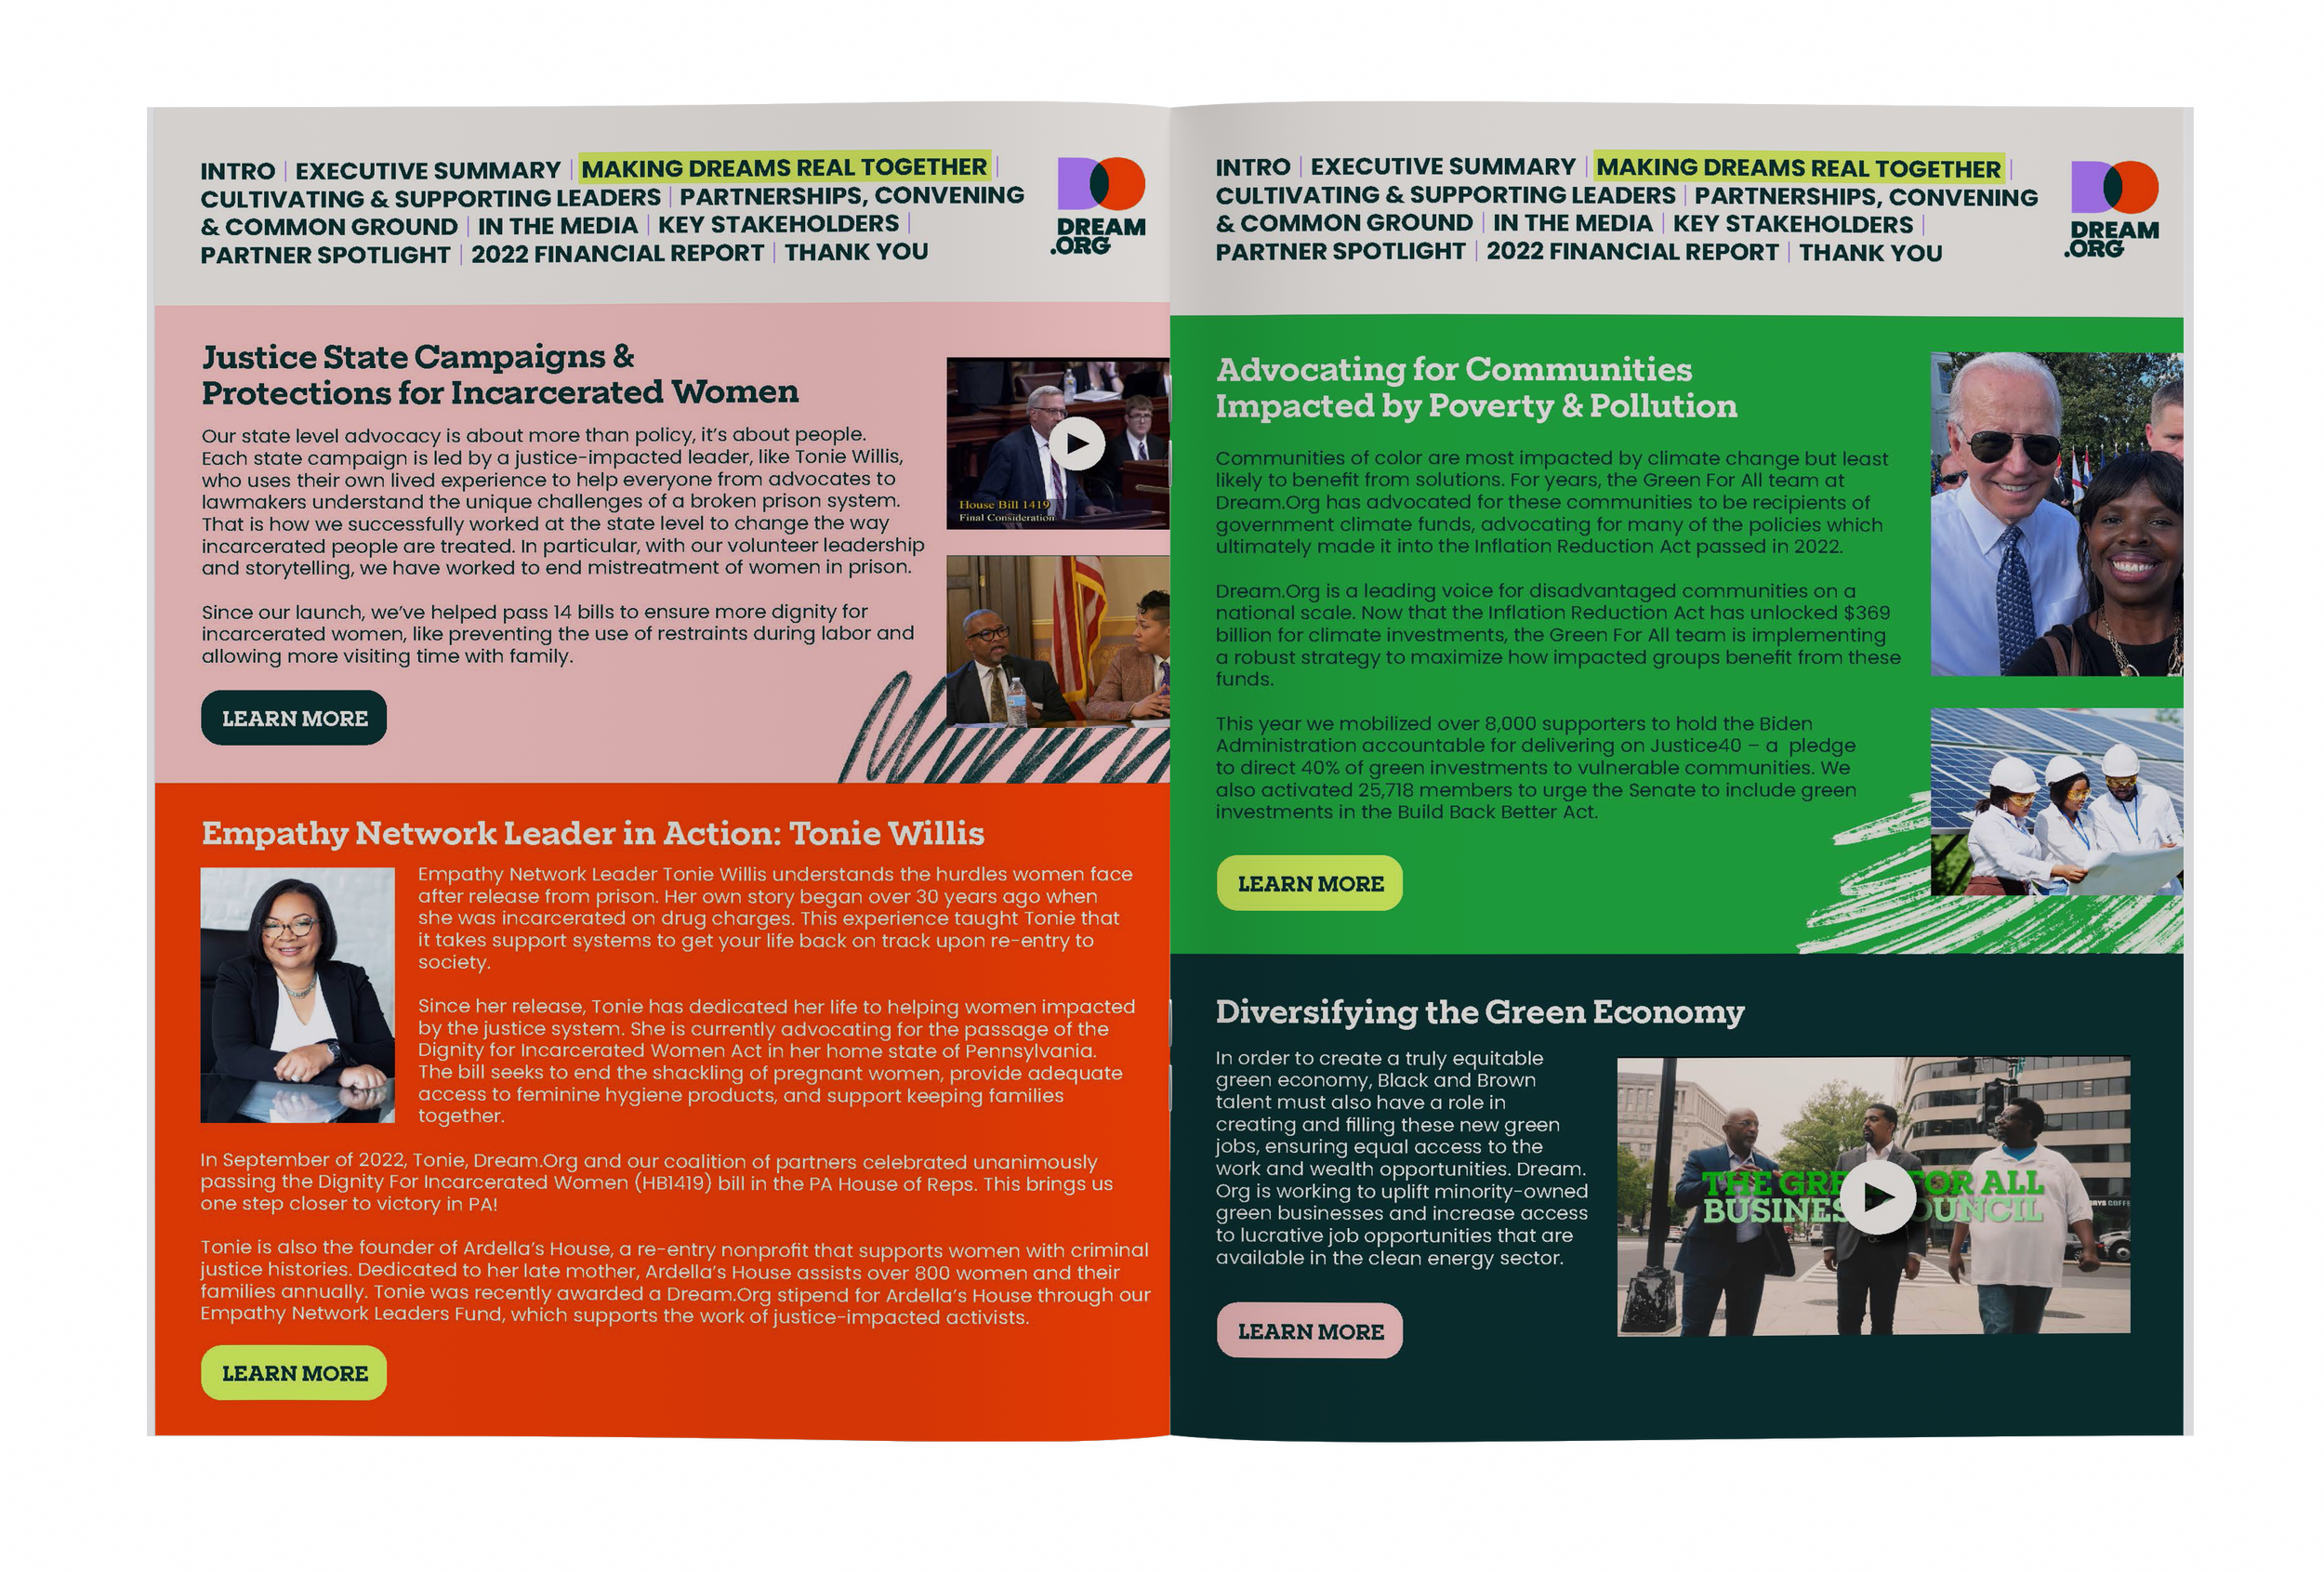
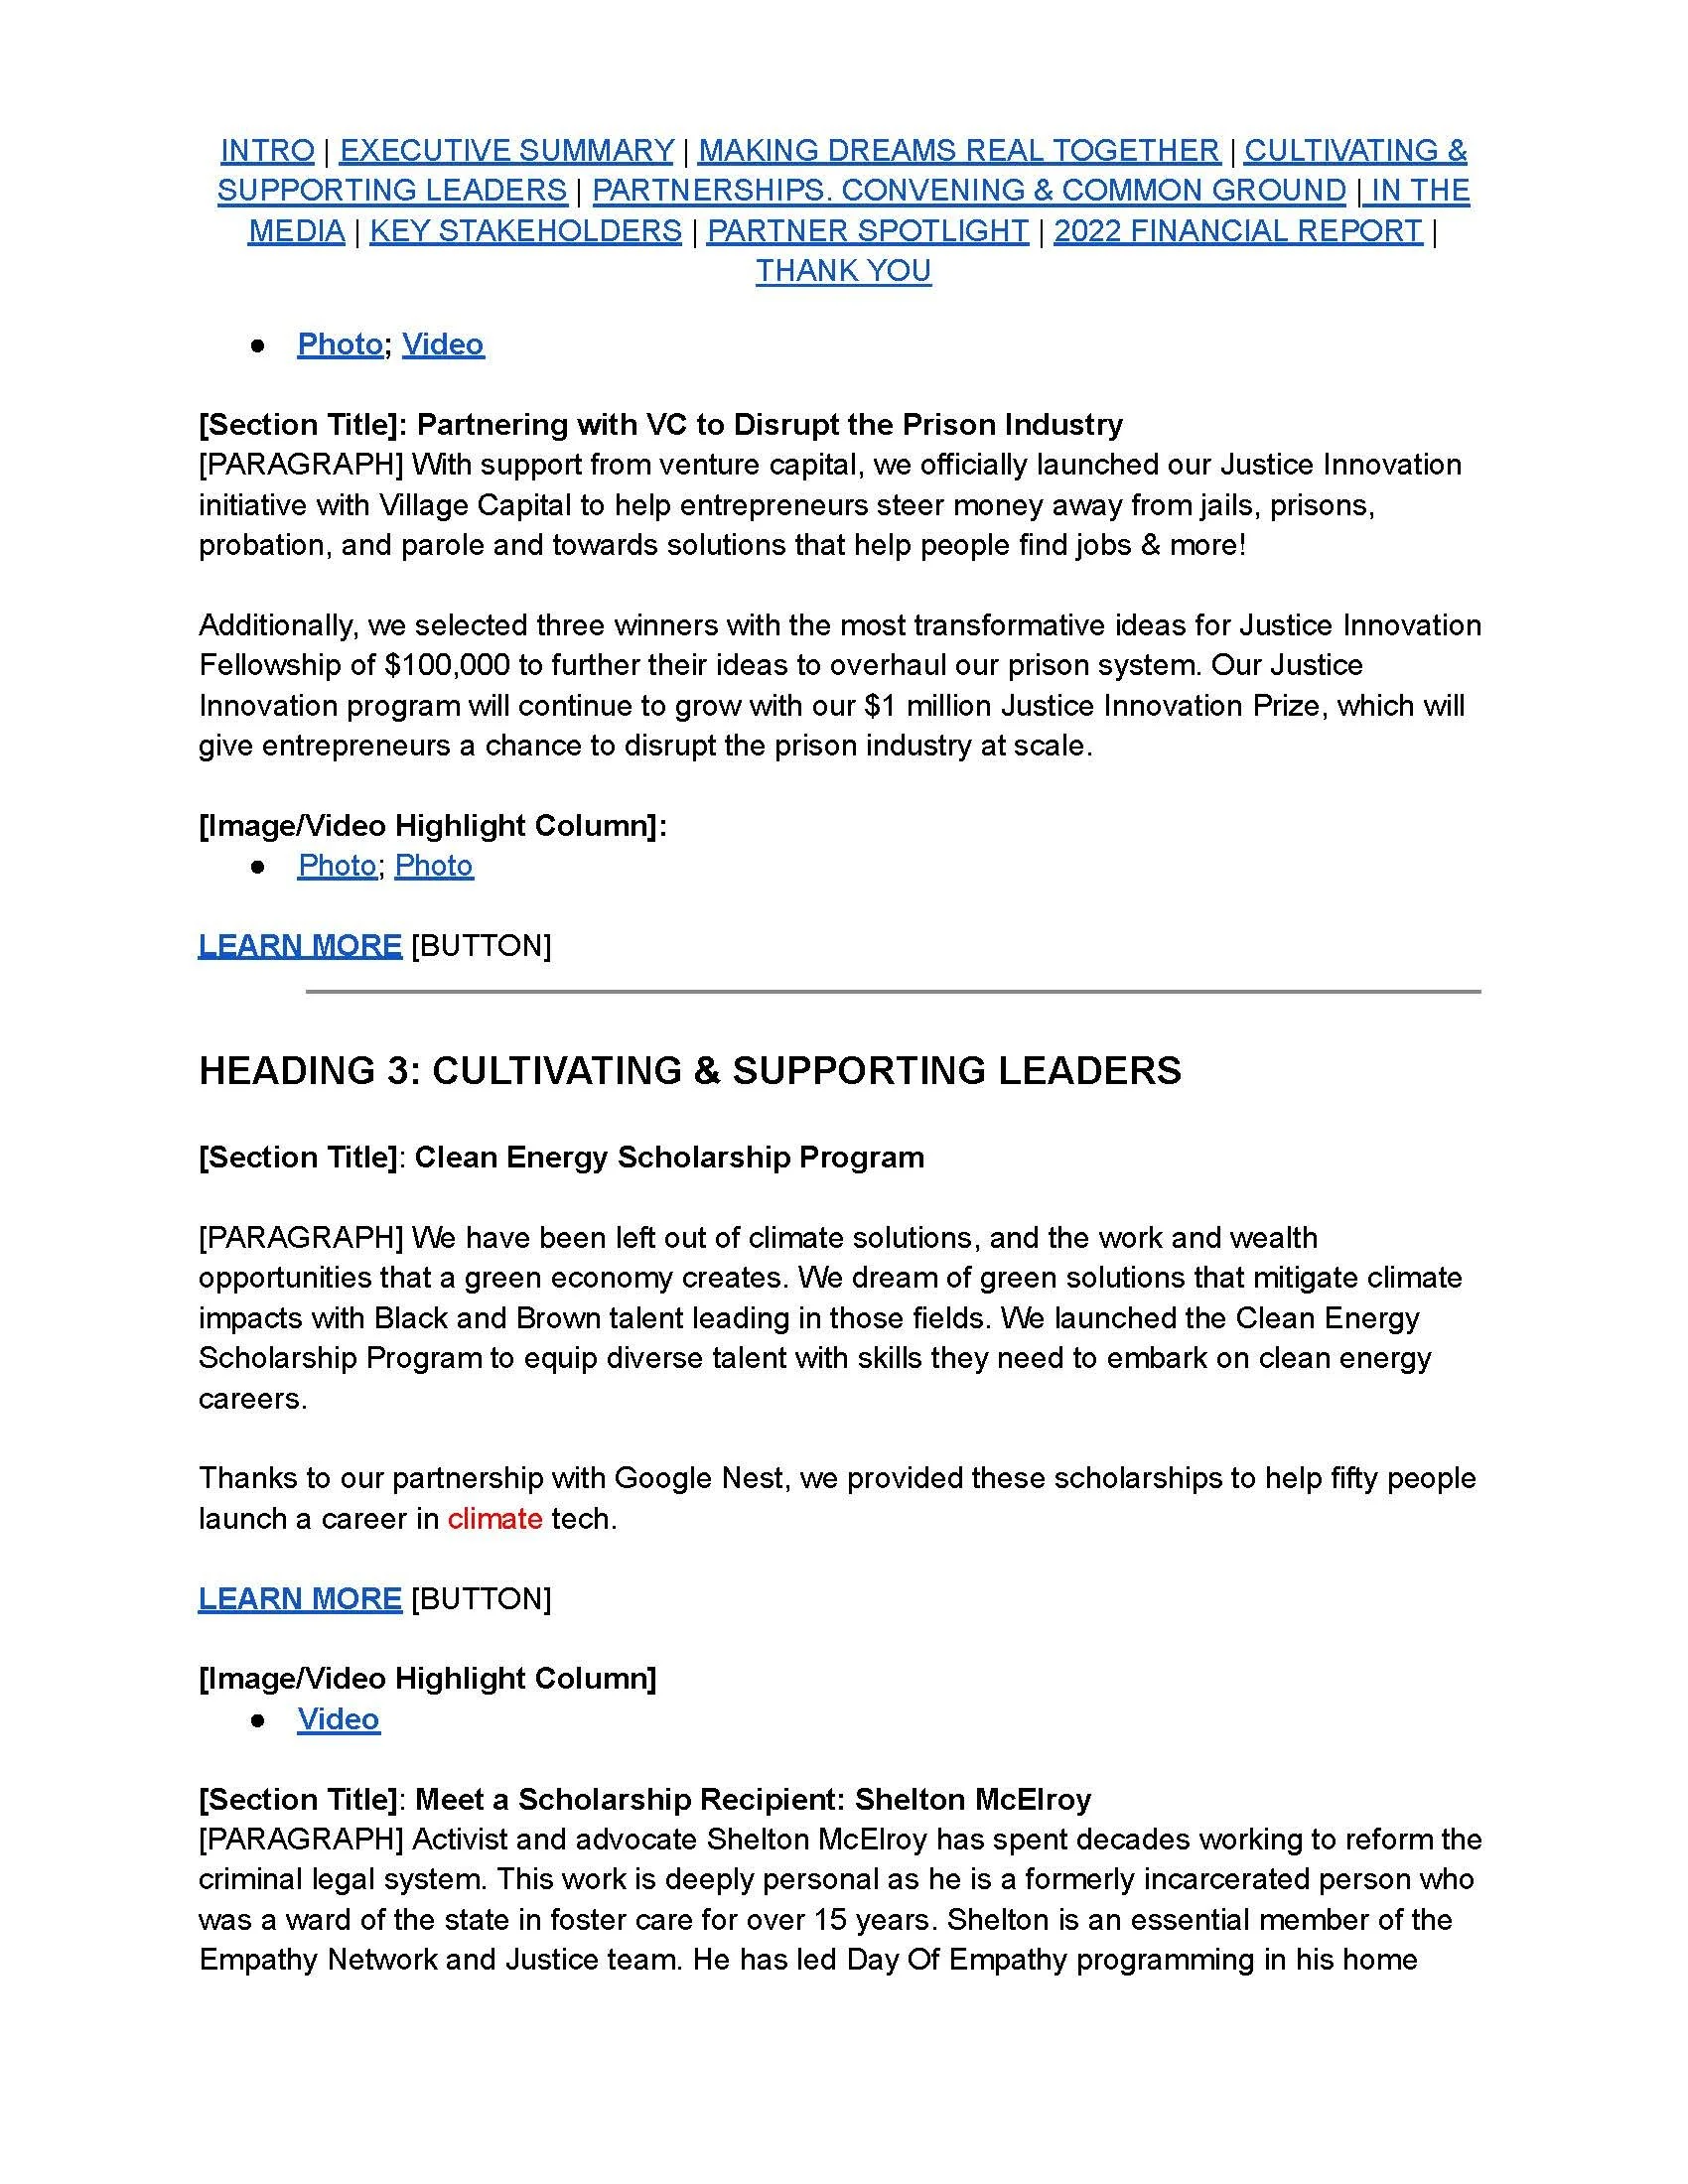
Before
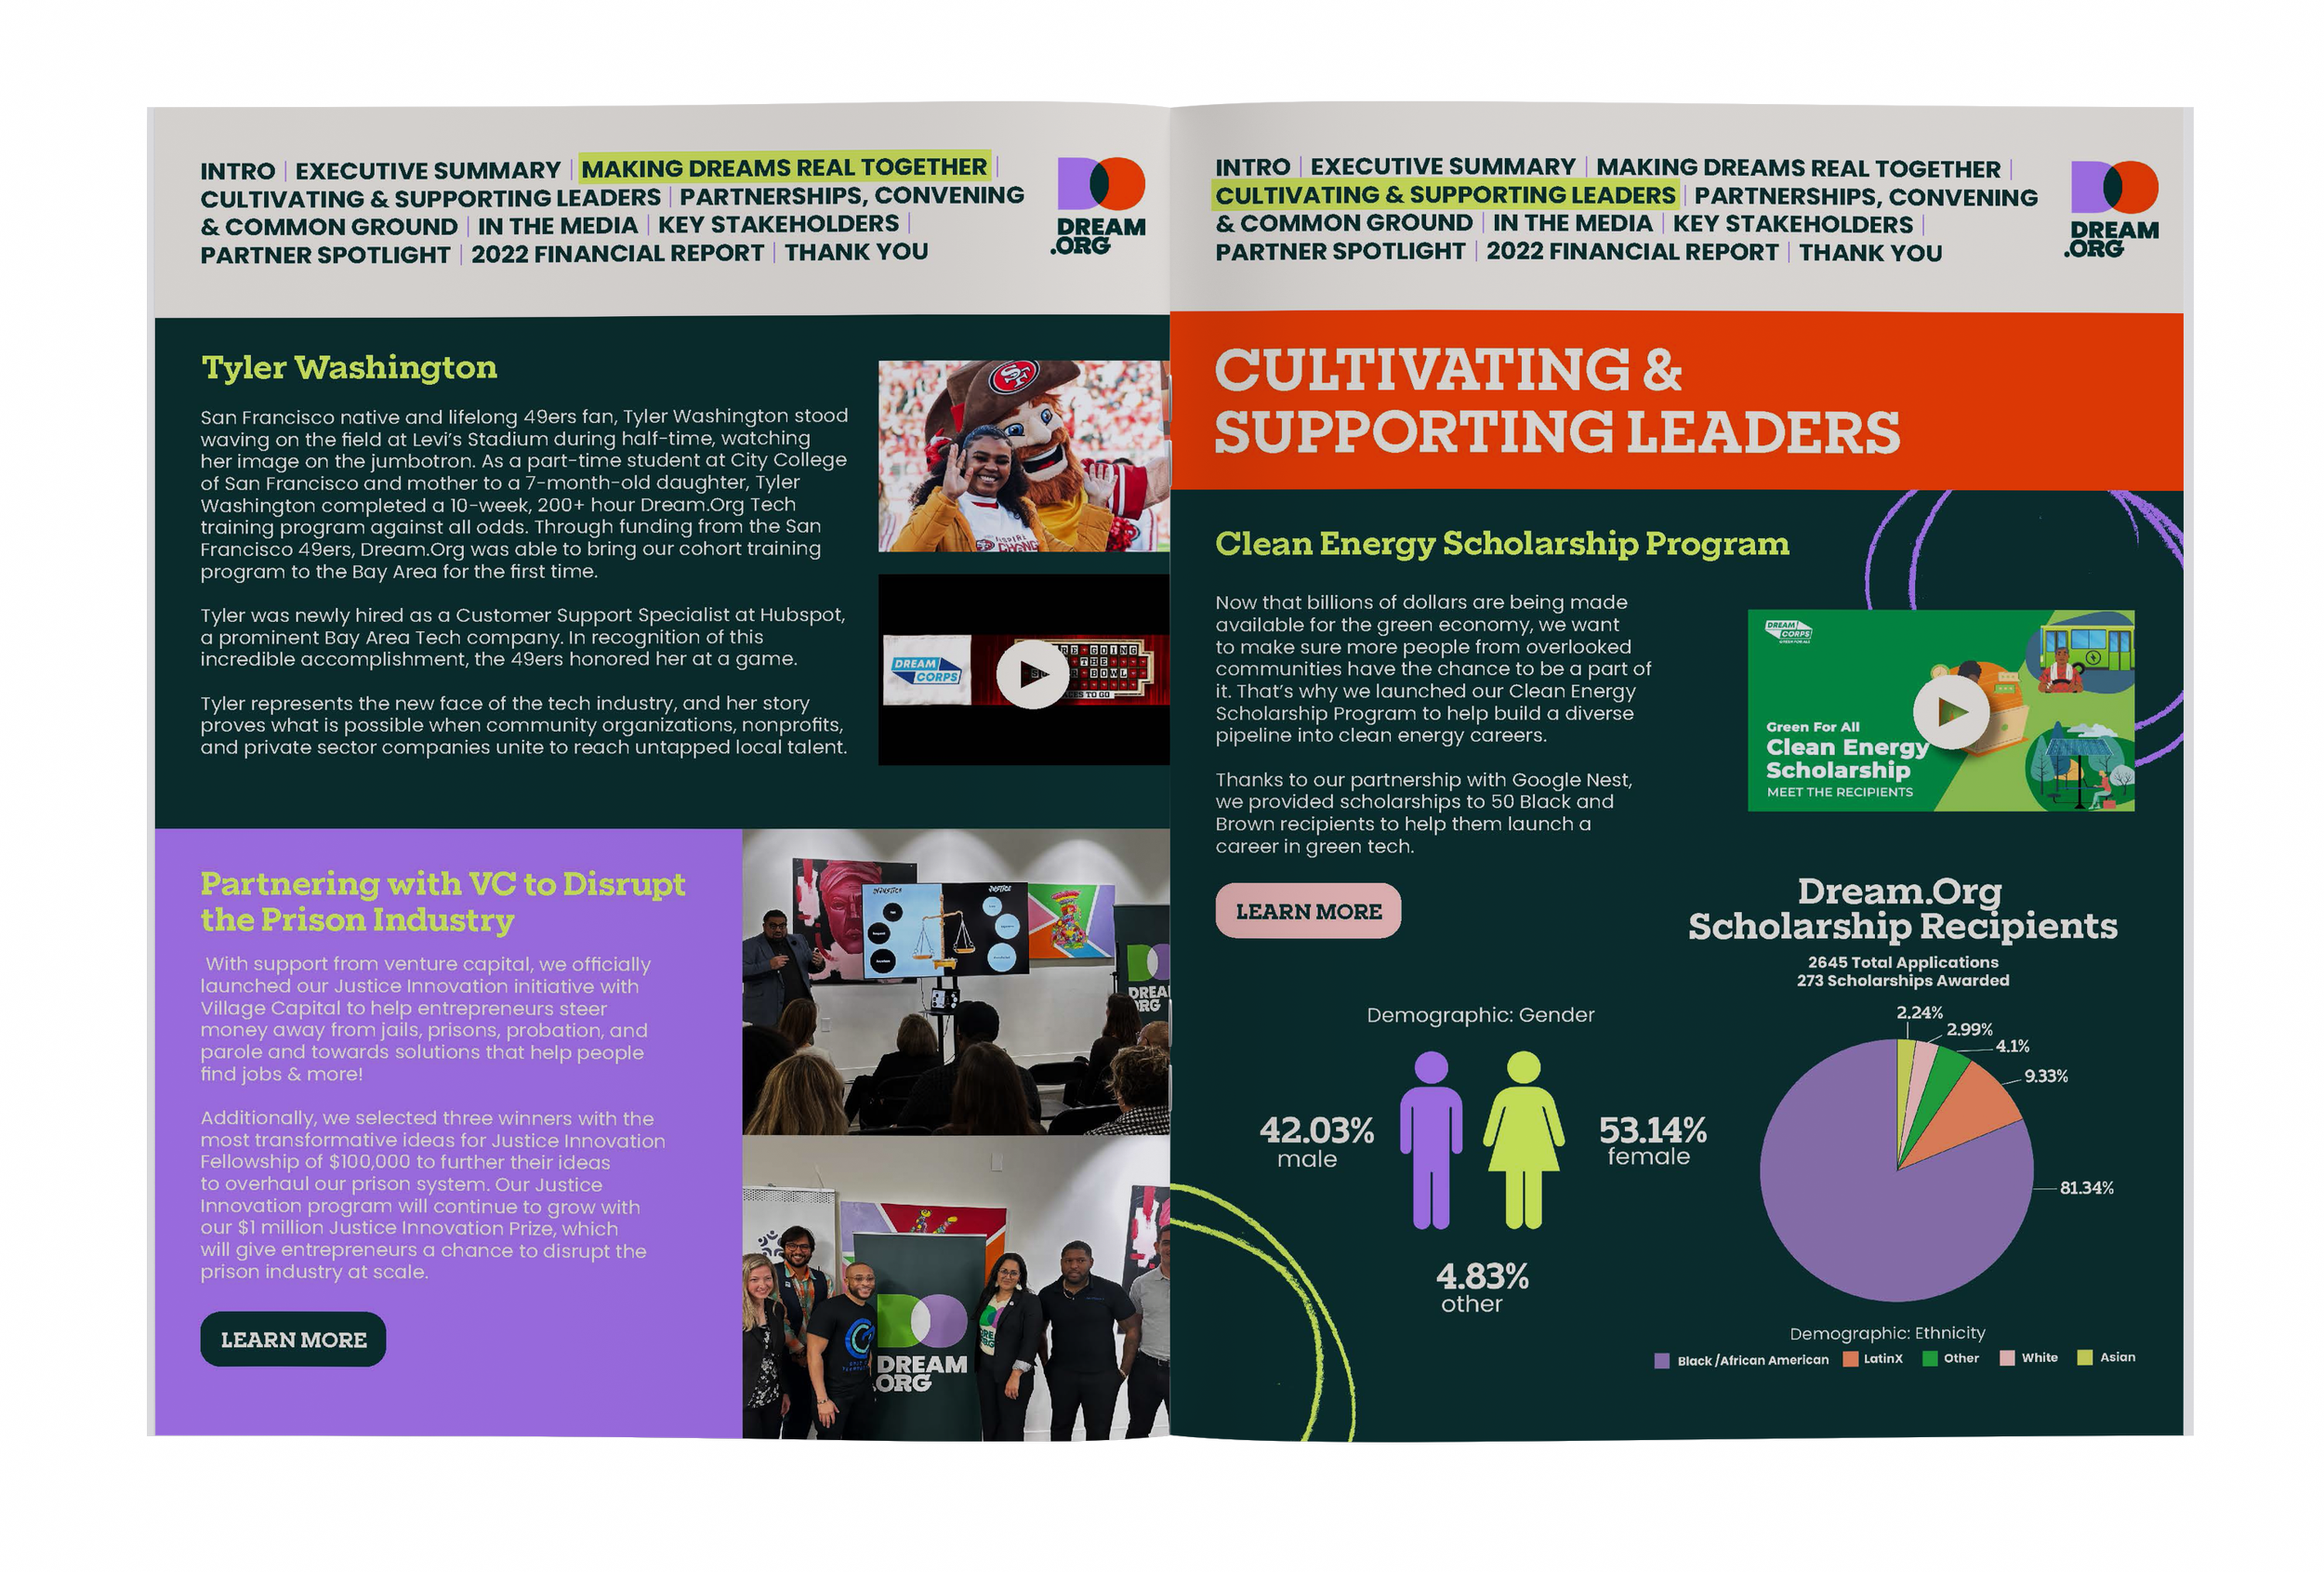
After
The Process: Hand Drawn Illustrations and Typography

To bring a more personal, creative touch to the report, I hand-drew custom illustrations that complemented Dream.org's existing visual identity. These assets added personality and visual interest throughout the publication, helping create a cohesive design while giving the report a more organic, approachable feel.
Design Approach
Working within Dream.org's established brand identity, I designed the entire report, developing unique layouts and visual treatments for each section. I used bold typography, vibrant colors, custom graphics, and data visualizations to create visual variety, establish hierarchy, and bring the organization's stories and accomplishments to life.
The Outcome
The finished report transformed the client's supplied content into a colorful, cohesive publication that balanced visual storytelling with information design, bringing consistency and personality to a wide range of content.
Explore The Full Report Below